Horizontal trend mode, Vertical bargraph mode, Horizontal trend – Carbolite nanodac User Manual
Page 25: Vertical bargraph, Nanodac
nanodac™
23
MC27 –EN–1.04
One of the channels is said to be the ‘current’ or ‘scale’ channel. This channel is identified by its pen icon
being displayed, and by the channel descriptor, dynamic value and its scale being displayed on a
‘faceplate’ across the width of the display, above the chart.
Each channel in the Group becomes the ‘current’ channel in turn, for approximately five seconds -i.e. the
channels are cycled through, starting with the lowest numbered channel. Once the final channel in the
Group has been displayed for five seconds, the first channel is returned-to and the process repeats. This
scrolling behaviour can be enabled/disabled from the top level menu ‘Faceplate Cycling (Off)’ item
described in Section 4.3.5
.
The scroll button can be used to cycle through the channels manually in both Faceplate cycle on and off
modes.
Use of the up arrow button causes the next enabled display mode to be entered (default = horizontal
trend).
The page key calls the top level menu.
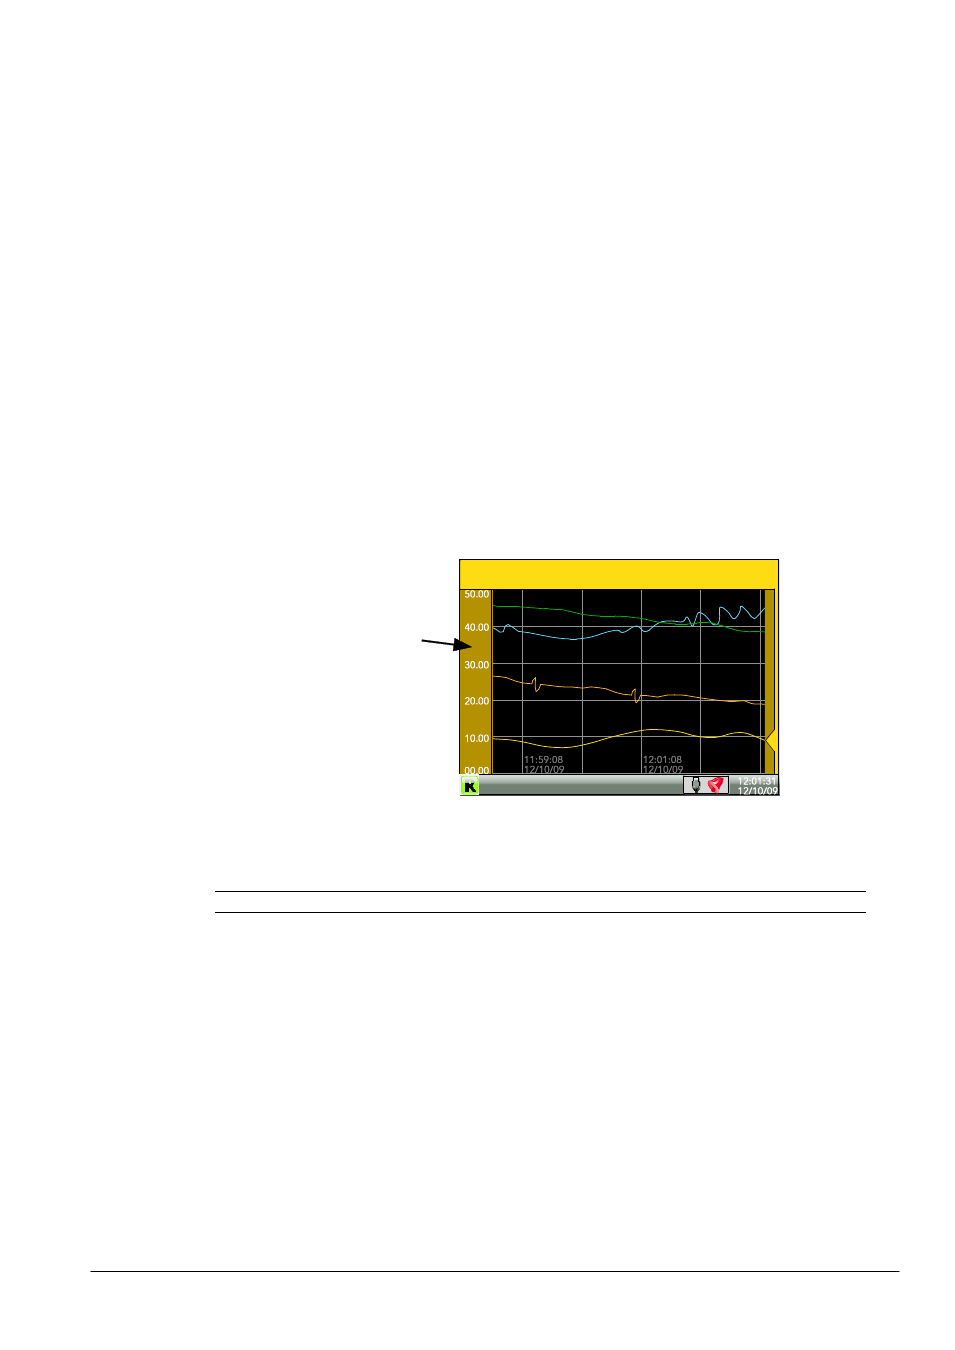
4.4.2 Horizontal Trend mode
This view is similar to the vertical trend mode described in section 3.4.1 above, except that the traces are
produced horizontally rather than vertically. Initially, as each channel appears, its scale appears at the left
edge of the display (as shown below), but in order to show the maximum amount of trend data, the scale
is overwritten after a few seconds.
Figure 1.4.2 Horizontal trend display mode
Note: Timestamps appear to the right of the gridline to which they relate
Use of the up arrow button causes the next enabled display mode to be entered (default = vertical
bargraph). Use of the page key calls the top level menu.
4.4.3 Vertical Bargraph mode
This display mode shows the channel values as a histogram. Absolute alarm threshold values appear as
lines across the bars, grey if the alarm is not triggered; red if the alarm is triggered. Alarm symbols appear
for active alarms.
Bargraph widths for four to six channels divide the width of the display screen equally between them. For
one and two channels, the width is fixed, and the bars are centred on the screen. Figure1.4.3 shows some
examples (not to the same scale).
By default, after a few seconds, the
‘chart’ expands leftwards to hide the
scale.