Nanodac – Carbolite nanodac User Manual
Page 112
nanodac™
MC27 –EN– 1.04
110
12.14
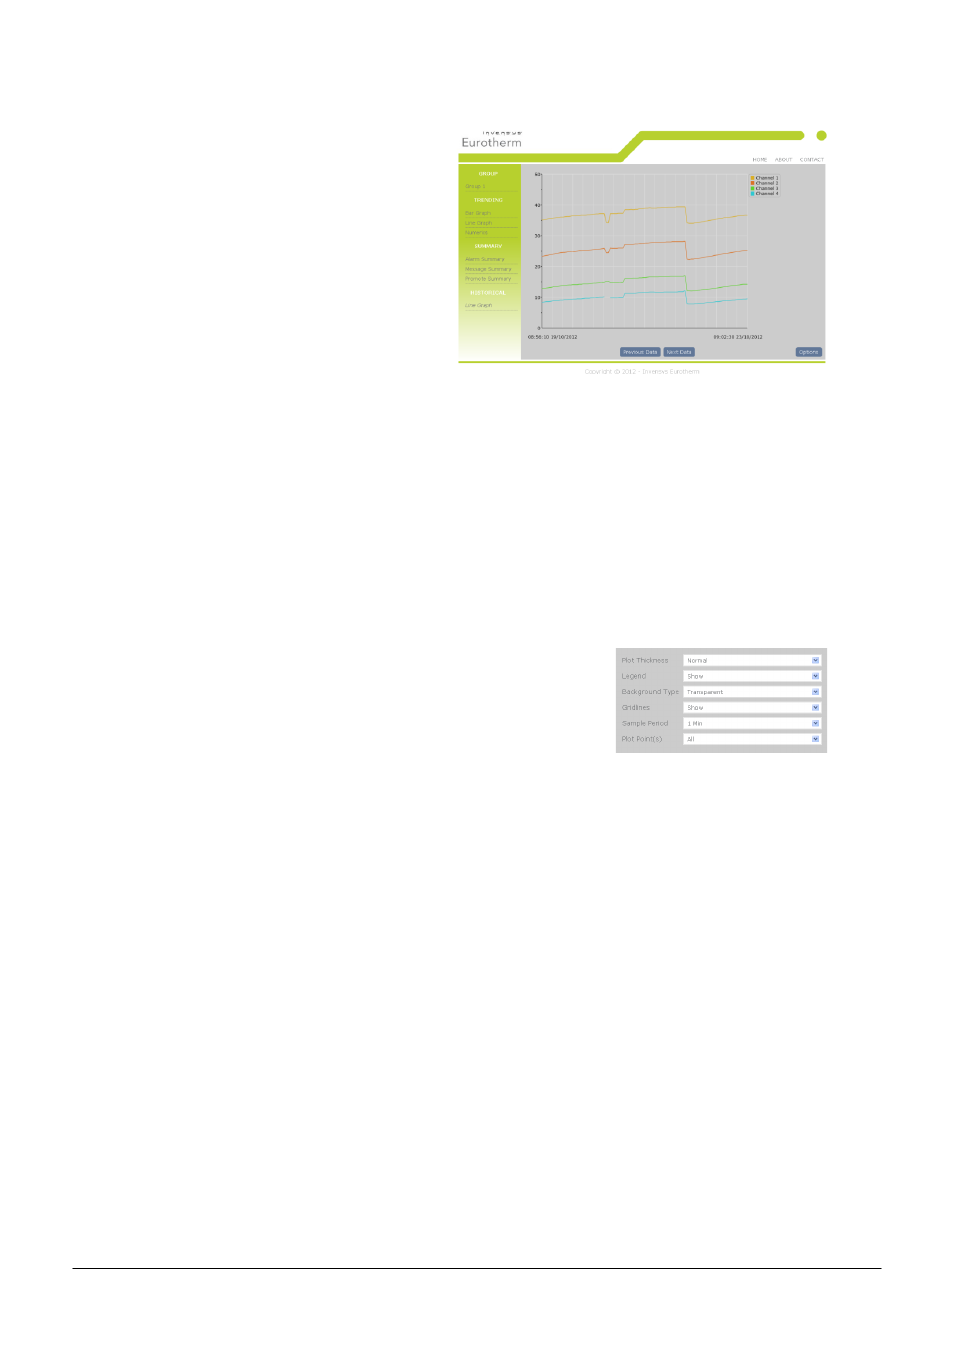
Historical Line Page
The channels that have been configured to be
trended in the nanodac instrument will
automatically be displayed on this page. The
current configuration data for those channels
will be used to render the values on the graph.
The graph will always use the largest scale
high and the lowest scale low of all the
channels being rendered
All channels will be represented in their
configured RGB colours. Colour matching will
very much depend on the display the browser
is running on.
This graph is currently fixed at 100 samples, and the first time this page is accessed it may take a short
time to load as the page will need to interrogate the web server for UHH history and render 100 samples
of backfill.
Use the ‘Previous Data’ button to navigate back in time for up to a maximum of five time periods of
history. If there is an end to the history event or a configuration change event, then the request to
navigate back may result in only part of the trend being populated up to that event time.
Use the ‘Next Data’ button to navigate back to the point in time when the web page was entered.
Options
The Options button allows the user some control over how the Historical Line page is displayed.
All data is stored as cookies.
Plot Thickness
Narrow, Normal, Wide.
Legend
Show, Hide.
Background Type
Transparent, White.
Gridlines
Show, Hide.
Sample Period
1 second - 1 hour.
Plot Point
All (shows all available channels)
Channel 1 only
Channel 2 only
Channel 3 only
Channel 4 only