Nanodac – Carbolite nanodac User Manual
Page 108
nanodac™
MC27 –EN– 1.04
106
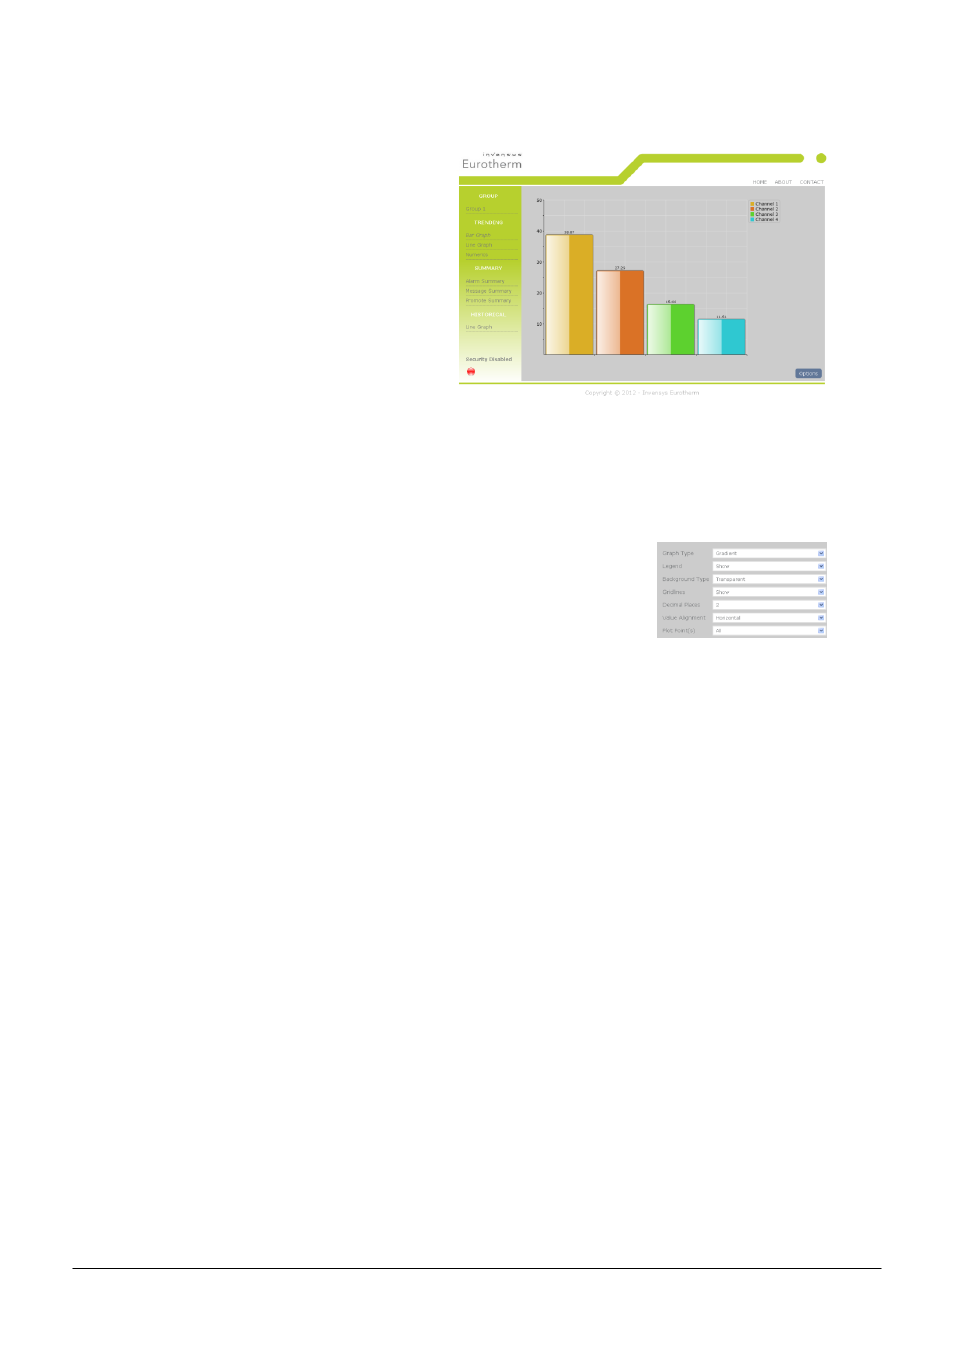
12.8 Bar Graph Page
The channels that have been configured to be
trended on the nanodac instrument will
automatically be displayed on this page. The
current configuration data for those channels
will be used to render the values on the graph.
The graph will always use the largest scale high
and the lowest scale low of all the channels
being rendered.
Click on a channel on the graph to display the
current channel status. To remove this, click
out of the graph again. The channel status will
either be 'Ok' or 'Error' for all other error
conditions.
All channels will be represented in their configured RGB colours. Colour matching will very much depend
on the display the browser is running on.
Options
The Options button allows the user some control over how the Bar Graph
page is displayed.
All data is stored as cookies.
Graph Type
Gradient (as shown in the above display)
Flat
3D
Legend
Show or Hide the Channel numbering legend in the top right hand corner
Background Type
Transparent or White
Gridlines
Show or Hide
Decimal Places
0 to 4
Value Alignement
Horizontal or Vertical
Plot Point
All (shows all available channels)
Channel 1 only
Channel 2 only
Channel 3 only
Channel 4 only