Display modes, Vertical trend, Nanodac – Carbolite nanodac User Manual
Page 24: 4 display modes
nanodac™
MC27 –EN– 1.04
22
To log in as Engineer (See section 1):
1.
Operate the up arrow key three times, to display ‘Engineer’.
2.
Press the scroll key to call the ‘alpha’ keyboard, with the letter ‘q’ highlighted.
3.
Use the down arrow key three times to highlight ‘Numeric’.
4.
Operate the scroll key to display the numeric keyboard (numeral ‘1’ highlighted.)
5.
Use the up and down arrow keys to select the numbers and use the scroll key to enter them.
6.
Use the Page key to call the confirmation display.
7.
If the password entry is as required, use the up arrow twice (or the down arrow once) to highlight the
word ‘Yes’ and operate the scroll key to confirm. The top level configuration menu appears.
Otherwise, ‘Cancel’ can be used to clear the entry in order to start again, or ‘No’ can be used to quit
login.
4.4 DISPLAY MODES
The following subsections describe the various display modes available to the user. By default, the ‘Home’
display mode is ‘Vertical Trend’, but this can be edited as a part of ‘
Instrument.Display
’ configuration. This
configuration area also allows the user to disable one or more display modes should they not be required.
The current display mode can be chosen either by using the top level menu ‘Go to View’ item or, from any
display mode, by scrolling through the enabled modes using the up or down arrow button.
Details of the various display modes are to be found in the following subsections:
Vertical trend
Section 4.4.1
Cascade Section 4.4.8
Horizontal trend
Section 4.4.2
Programmer (inc. future trend) Section 4.4.9
Vertical bargraph
Section 4.4.3
Horizontal bargraph Section 4.4.4
Promote list
Section 4.4.10
Numeric Section 4.4.5
Modbus Master
Section 4.4.11
Alarm panel
Section 4.4.6
EtherNet/IP
Section 4.4.12
Control loop 1/2
Section 4.4.7
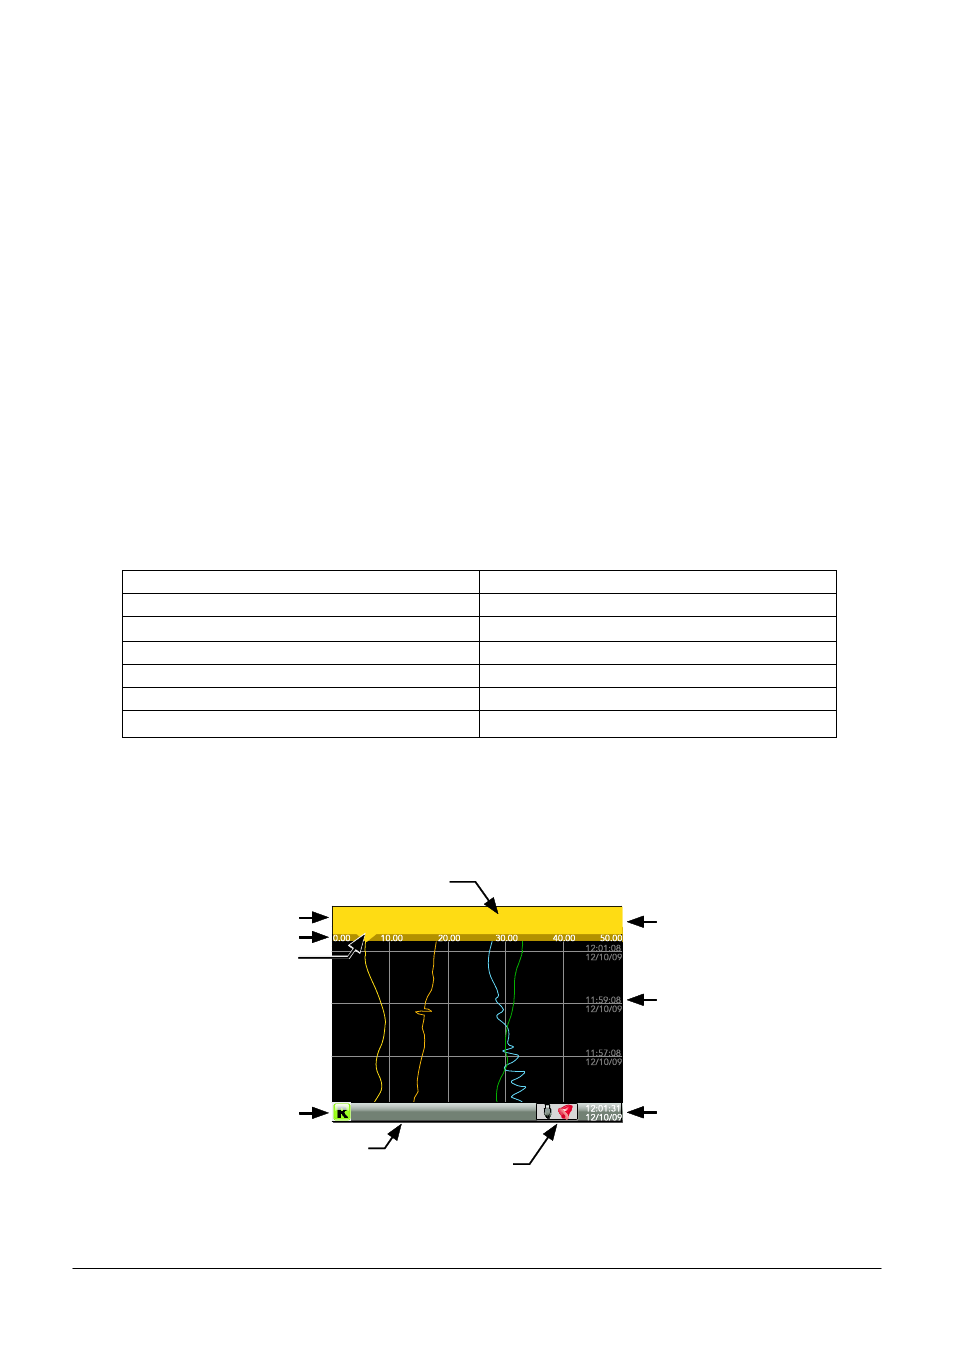
4.4.1 Vertical Trend
In this mode, channel values are traced as though on a chart rolling downwards (i.e with the latest data at
the top). The chart speed, and the number of major divisions are configured in the ‘Group.Trend’ area of
configuration (5.2.1).
Figure 1.4 Vertical trend mode display elements
Faceplate
Current point name
Current point scale
Current trace ‘pen’
Recording symbol
Current point value
Time/date stamp
Current time/date
Instrument name
Status icons