5 colorizing a chart – Innovate Motorsports LogWorks 3 User Manual
Page 98
LogWorks3_Manual_1.01.doc
- 98 -
9.5 Colorizing a chart
You can color a chart by average value, Standard Deviation or Number of data points. You can
also choose between 4 different color schemes. The Colorize pane will become active as shown
below.
To quickly colorize a chart by the average value, click on the colorizing button
in the toolbar.
To colorize you can also select in the Chart menu:
Colors->Colorize by average value
,
Colors->Colorize by standard deviation
or
Colors->Colorize by number of datapoints
.
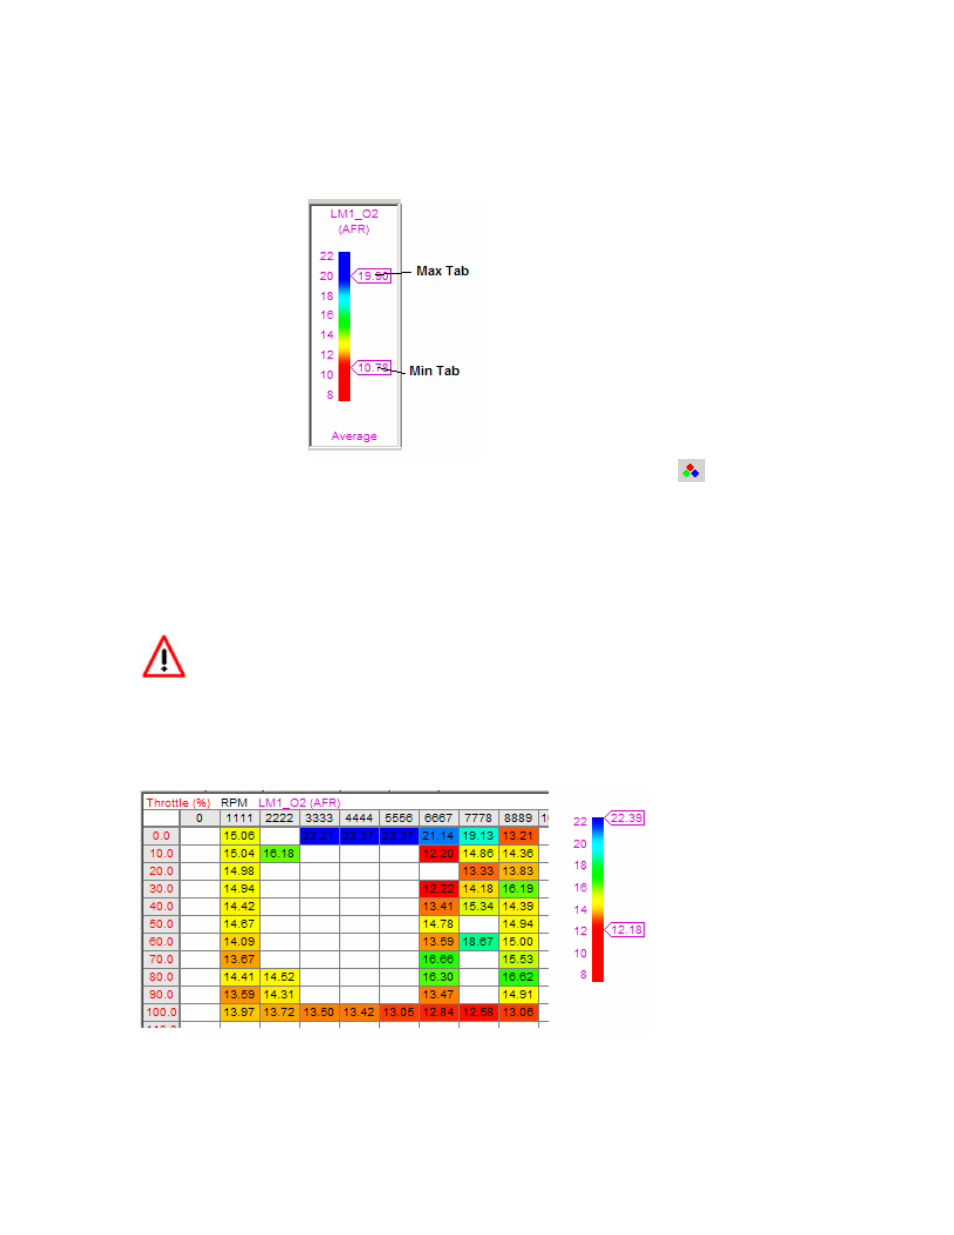
By moving the Max and Min tabs you can limit the colorization to the value range
you are interested in. The range can be limited to as small as 10% of the total range of the
channel.
If colorizing by Number of data points the scale for the colors is logarithmic.
Example of a colorized chart:
To switch colorizing off, either select in the chart menu:
Colors->No Color
or