3 text table view – Innovate Motorsports LogWorks 3 User Manual
Page 87
LogWorks3_Manual_1.01.doc
- 87 -
8.3.3
Text Table View
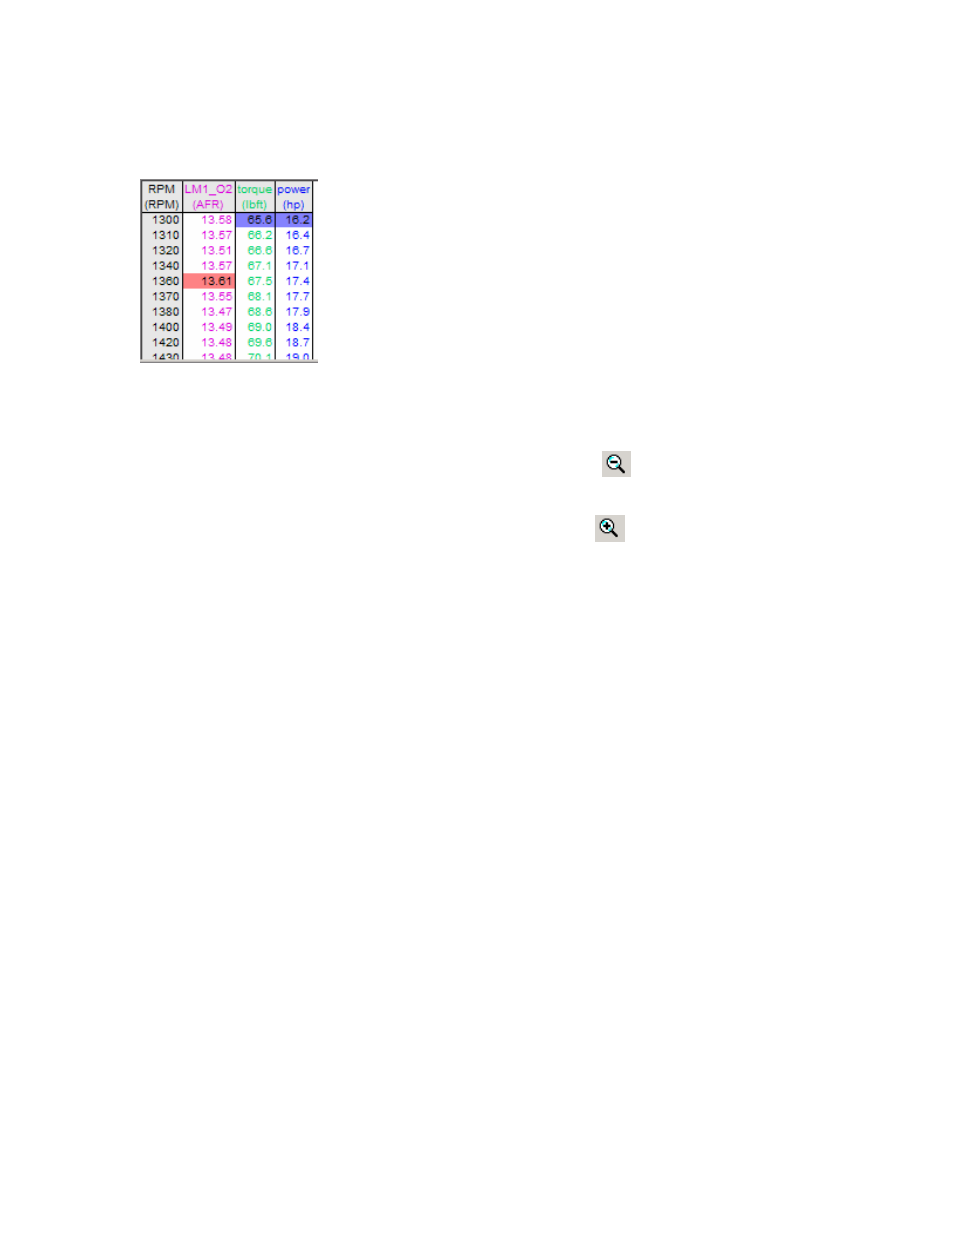
Text table view shows all the data points sorted by the X-axis channel. Like in this:
The leftmost column is the x-axis by which the other channels are sorted. The columns to the
right are the Y-axis channels. The minimum of each channel is highlighted in blue. The maximum
is highlighted in red.
To quickly find the minimums, use the Zoom Out tool in the toolbar
and click on the column
of the channel you want to search.
To quickly find the maximums, use the Zoom In tool in the toolbar
and click on the column of
the channel you want to search.
You can also copy the entire table as tab delimited text onto the clipboard of the computer with:
Views/Command->Copy Table to clipboard
This can be subsequently pasted into other programs that accept tab delimited text like Excel,
Word and so on.
Overlaid data is not shown in the text table view.