5 marker lines, 6 min max info – Innovate Motorsports LogWorks 3 User Manual
Page 89
LogWorks3_Manual_1.01.doc
- 89 -
Select in the X-Y-Plot menu:
Views/Command->Autoscale X axis
This will automatically scale and scroll the x-axis such that the actual recorded data range of the
x-axis channel fits exactly in the graph pane.
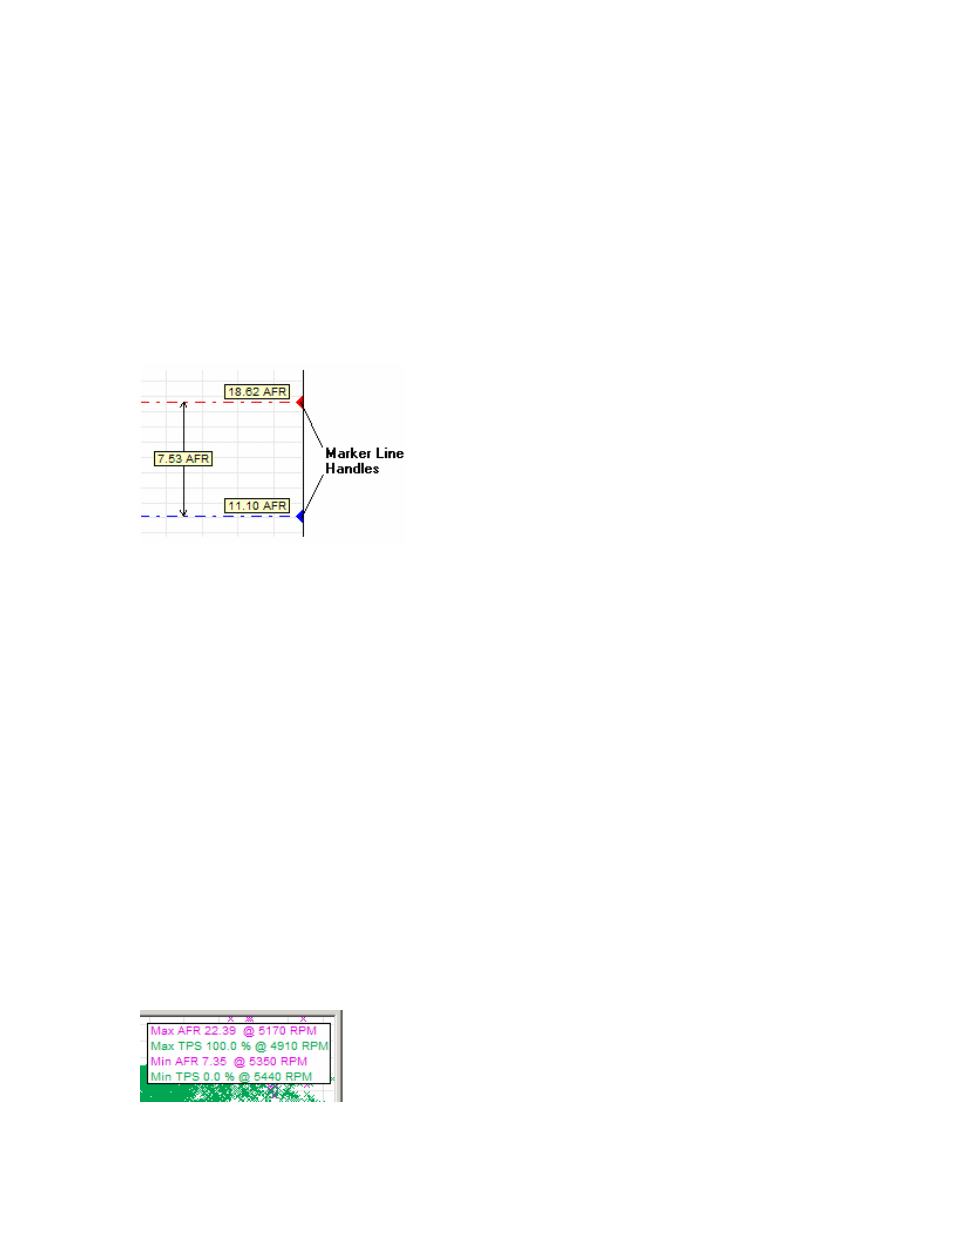
8.5 Marker Lines
Marker lines are dash-dotted lines used to give an easy visual reference to see if y-channel data
is above or below a certain value or is in a value range. Marker lines are red (max marker line)
and blue (min marker line).
To show Marker lines for a Y-channel:
Select the channel with:
Info->Marker Lines->Channel Name
To move the marker lines click and drag the marker line handles. While the left mouse button is
down on the marker line handles, the exact measurement position of the marker lines and their
distance is shown.
To remove the marker lines:
Select
Info->Marker Lines->No Marker
8.6 Min Max Info
To show the Min and/or Max value of a Y channel shown in the X-Y Plot in reference to the X-axis
channel, select:
Info->Show Max Value->Channel Name
or
Info->Show Min Value->Channel Name
A Min/Max Window will show in the graph pane: