3 x-y plot representation, 1 scatter plot, 2 line plot – Innovate Motorsports LogWorks 3 User Manual
Page 86
LogWorks3_Manual_1.01.doc
- 86 -
Changing the selection in the Log Window will automatically update all X-Y Plots open for that
log.
8.3 X-Y Plot representation
The X-Y Plot can show the channel date as scatter plot, line plot or text table.
8.3.1
Scatter Plot
Select scatter plot view with:
Views/Commands->View as scatter Plot
Or click on the scatter plot button
in the X-Y Plot toolbar.
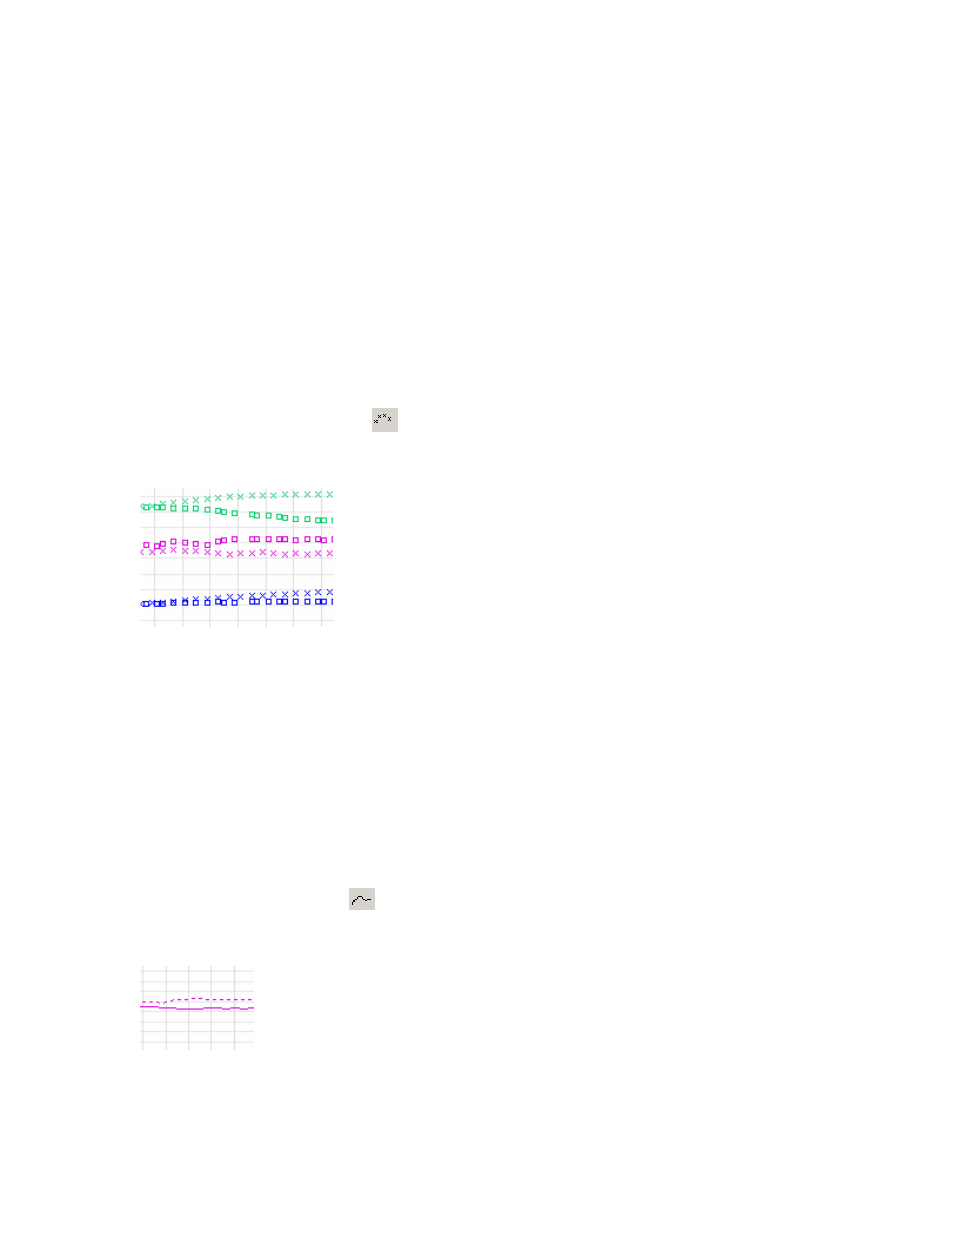
A scatter plot looks like this:
Each data point is shown with a little x.
If overlays are on the current session (see chapter 7.5.5), then the overlay data points are shown
as little squares.
8.3.2
Line Plot
A line plot connects all the data points with lines in the order in which the data points are
recorded.
Select line plot view with:
Views/Commands->View as line plot
Or click on the line plot button
in the X-Y Plot toolbar.
A line plot looks like this:
If overlays are on the current session (see chapter 7.5.5), then the overlay data point lines are
shown dashed.