3 opening x-y plot views – Innovate Motorsports LogWorks 3 User Manual
Page 80
LogWorks3_Manual_1.01.doc
- 80 -
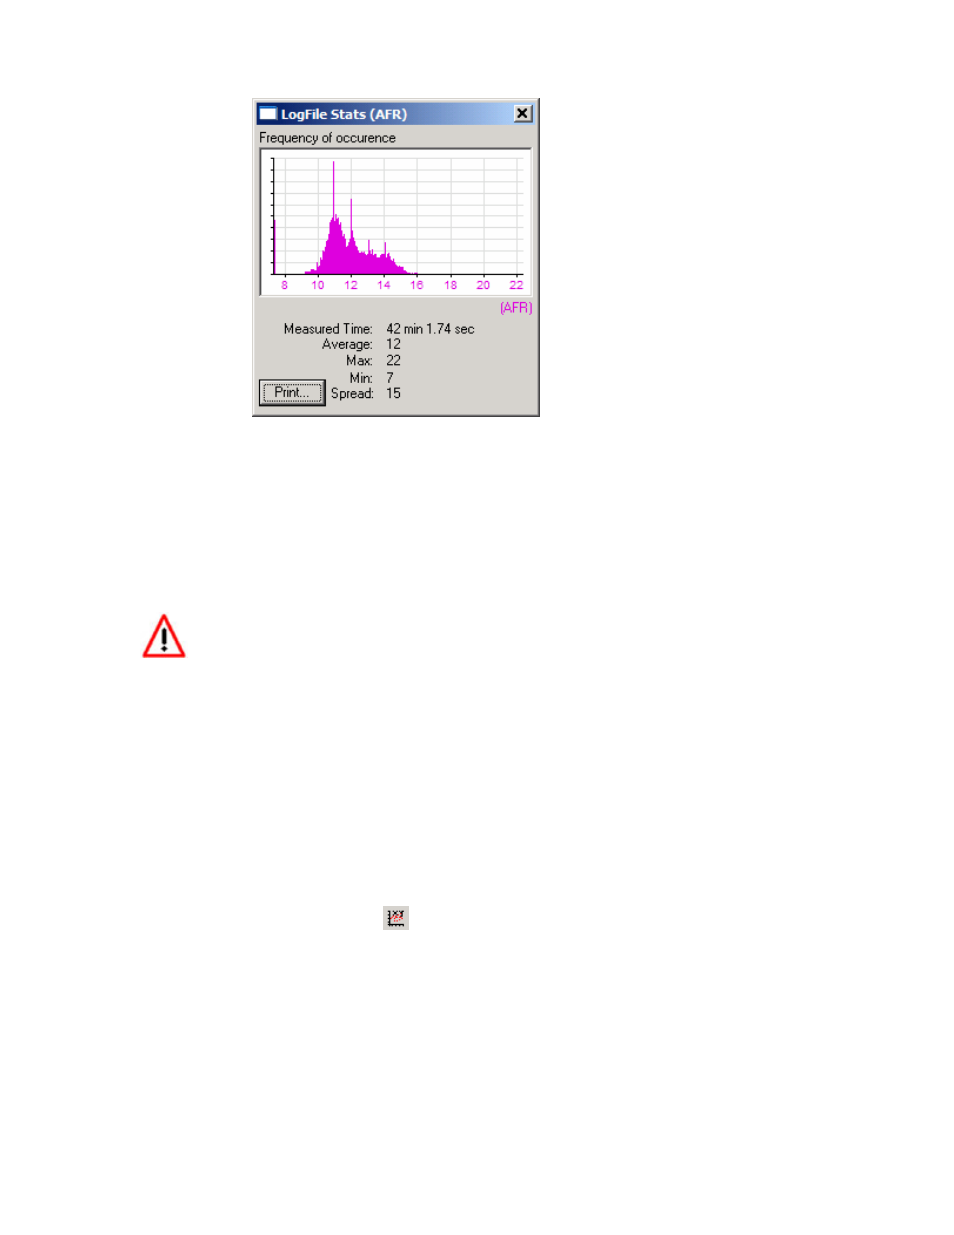
This window shows how often a certain input value happened during a session or partial session.
If nothing in the graph is selected, the Statistics window represents the data of the entire session.
If a part of the session is selected (Selection Tool), only the data of the selected areas is
represented.
The vertical axis is automatically scaled relative to the highest occurrence. The horizontal axis is
automatically scaled to the range of the input with the session or selection.
In addition the window shows how many data points (time) are represented, the average of the
selected data and the minimum and maximum points in the selected data range or entire session.
Manipulating the session data with the smoothing filter, changing selection or
adding/deleting measurement points will be automatically represented in the statistics.
7.7.3
Opening X-Y Plot Views
Open an X-Y Plot View with the Log Window menu Item:
View->New XY Plot…
Or keyboard shortcut Ctrl-Y
This opens a new X-Y plot with default channel assignments.
Or click on the New XY Plot button
in the Log Window toolbar.
When clicking on the New XY Plot button, the last opened XY Plot settings are applied. If there
have not been any xy-plots opened yet, the default channel assignments are used.
A X-Y Plot is a plot of the session data with one channel (for example RPM) on the X axis and
other channels (like AFR, torque, power…) on the Y axis.
This is similar to a dyno graph. See chapter 8 for details.
You can also open XY-Plots from stored XY templates with: