8 x-y plots – Innovate Motorsports LogWorks 3 User Manual
Page 83
LogWorks3_Manual_1.01.doc
- 83 -
8 X-Y Plots
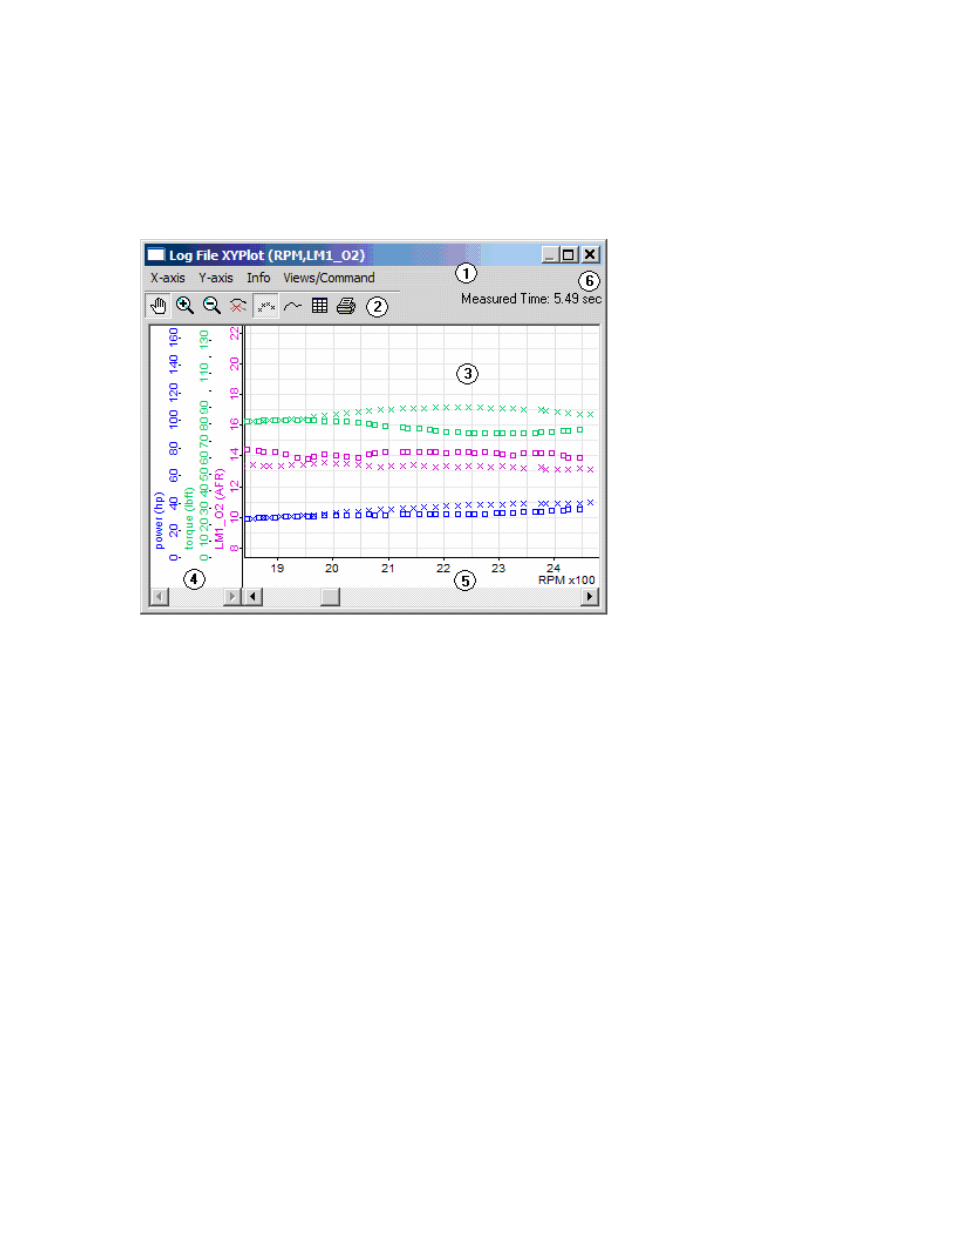
An X-Y Plot is a View of a log where the data is sorted along a specified channel (x-axis) and the
vertical axis shows other channels in their relationship to the x-axis channel.
This is an X-Y Plot in Cartesian coordinates showing power, torque and AFR over RPM.
The X-Y Plot window can be resized to any size. It is divided into different areas and has 2
different panes:
The scale pane (4) shows the vertical scale, the graph pane (3) shows plots of the channels.
Here’s a short description of the parts of the X-Y Plot Window.
1. Menu area
Contains the XY menus.
2. Tool Bar.
Allows selecting the various tools and functions to manipulate the X-Y Plot.
3. Graph Pane
Shows the graphs of the active channels color coded.
4. Vertical scale Pane
Shows the vertical scale of the graph for the various channels.
5. X-Axis scale
Shows the scale of the selected X-axis channel.
6. Measurement Time
Shows the amount of accumulated time in the session contributing to the X-Y Plot.