4 opening 3d charts – Innovate Motorsports LogWorks 3 User Manual
Page 81
LogWorks3_Manual_1.01.doc
- 81 -
View->XY From Template->Template Name
If any XY Plot templates are stored in either the Log File or the generic LWSettings file.
If there are templates in both, the menu will indicate that. Templates that can’t be applied
because the associated channel names have changed, are grayed out.
For details on how to store XY Templates, see chapter 8.
7.7.4
Opening 3D charts
Open a 3D chart View with the Log Window menu Item:
View->New Chart
Or click on the New Chart button
in the Log Window toolbar.
When clicking on the New Chart Plot button, the last opened chart settings are applied. If there
have not been any charts opened yet, the default channel assignments are used.
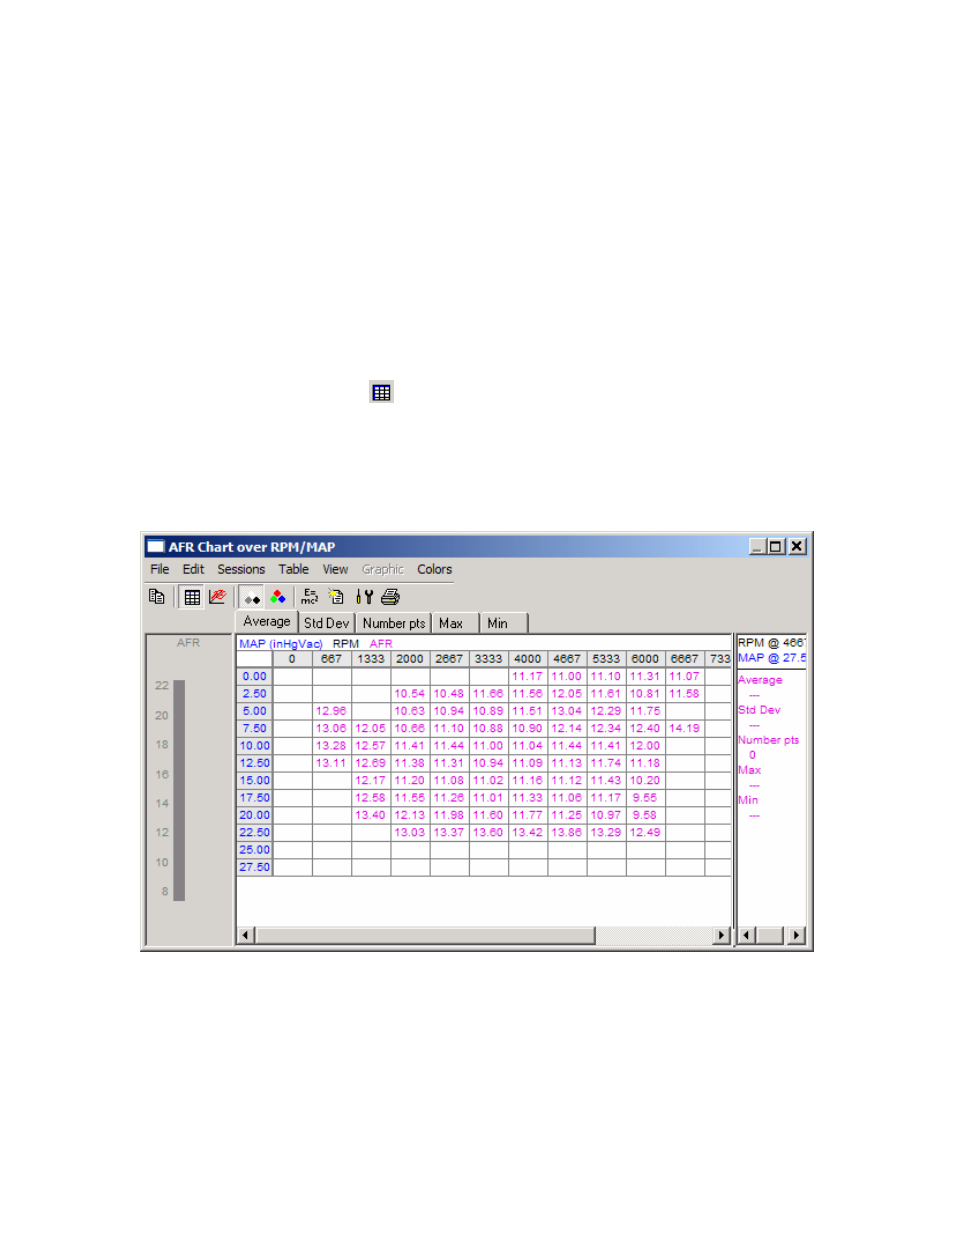
With this item a new 3D chart can be specified. A 3D chart is a table (or graph) that shows the
contents of a channel as dependent on two other channels as in this example:
This example shows average AFR over Manifold Pressure and RPM.
The fuel map or ignition map of an electronic fuel injection system is a typical example for such a
map.
For further details see chapter 9
When the New Chart menu item is selected, the following dialog box will show up: