3 overlays on 3d graphs – Innovate Motorsports LogWorks 3 User Manual
Page 107
LogWorks3_Manual_1.01.doc
- 107 -
9.9.3
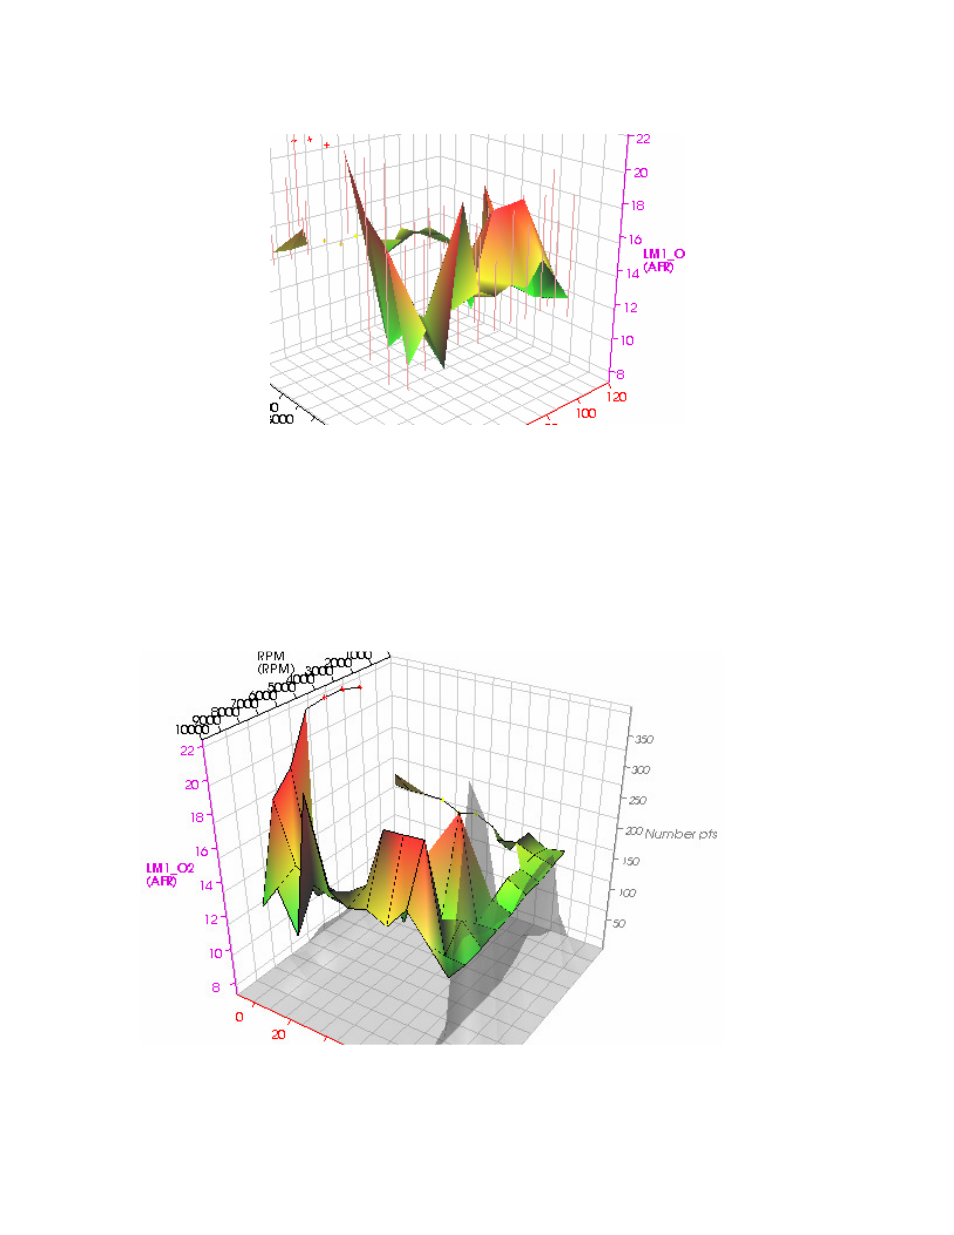
Overlays on 3D graphs
Just as you can in the table view of the charts, you can overlay another sub-chart in the graph
view as well. Select which sub-chart you to overlay want with:
View->Overlay on current view->subchart name
.
Overlays are shown in gray, half transparent as in this view:
Here the number of data points sub-chart is overlaid on the colorized average view.
As the sessions included in this particular chart are mostly at WOT, most of the data points are
located at the WOT line.
See also other documents in the category Innovate Motorsports Measuring instruments:
- MTX-D, Water Temperature/Volt Gauge (10 pages)
- MTX-D, Oil Temperature/Pressure Gauge (10 pages)
- MTX-D, EGT Gauge (10 pages)
- MTX-D, Boost/Shift Gauge (12 pages)
- MTX-L (16 pages)
- LC-2 (12 pages)
- LM-2 (50 pages)
- DB Digital Air/Fuel Gauge (1 page)
- TC-4 (11 pages)
- SSI-4 (16 pages)
- DL-32 (30 pages)
- Autronic Output Cable (1 page)
- Analog Display (1 page)
- ST-12 (33 pages)
- LC-1 (24 pages)
- XD-16 (18 pages)
- LMA-3 (30 pages)
- LM-1 RPM Converter (Aux. Input Cable 2) (9 pages)
- LM-1 Digital Air/Fuel Ratio (Lambda) Meter (26 pages)
- PL-1 (9 pages)
- SCG-1 (19 pages)
- OT-2 (26 pages)
- OT-1 (29 pages)
- RAD-1 (1 page)
- G3 Air/Fuel Gauge Manual (four connector model) (2 pages)
- G3 Air/Fuel Gauge Manual (single connector model) (1 page)
- G2/G4/G5 Air/Fuel Gauge Manual (four connector model) (2 pages)
- G2/G4/G5 Air/Fuel Gauge Manual (single connector model) (1 page)
- LM-2 Quick Start Guide (2 pages)
- MTX-L Quick Start Guide (2 pages)
- LM-1 Quick Start Guide (2 pages)
- LC-1 Quick Start Guide (2 pages)
- XD-16 Quick Start Guide (2 pages)
- Standalone Gauge Kit Quick Start Guide (2 pages)
- OT-2 Quick Start Guide (2 pages)
- DL-32 Quick Start Guide (2 pages)
- OT-2 SDK (76 pages)