Innovate Motorsports LogWorks 3 User Manual
Page 136
LogWorks3_Manual_1.01.doc
- 136 -
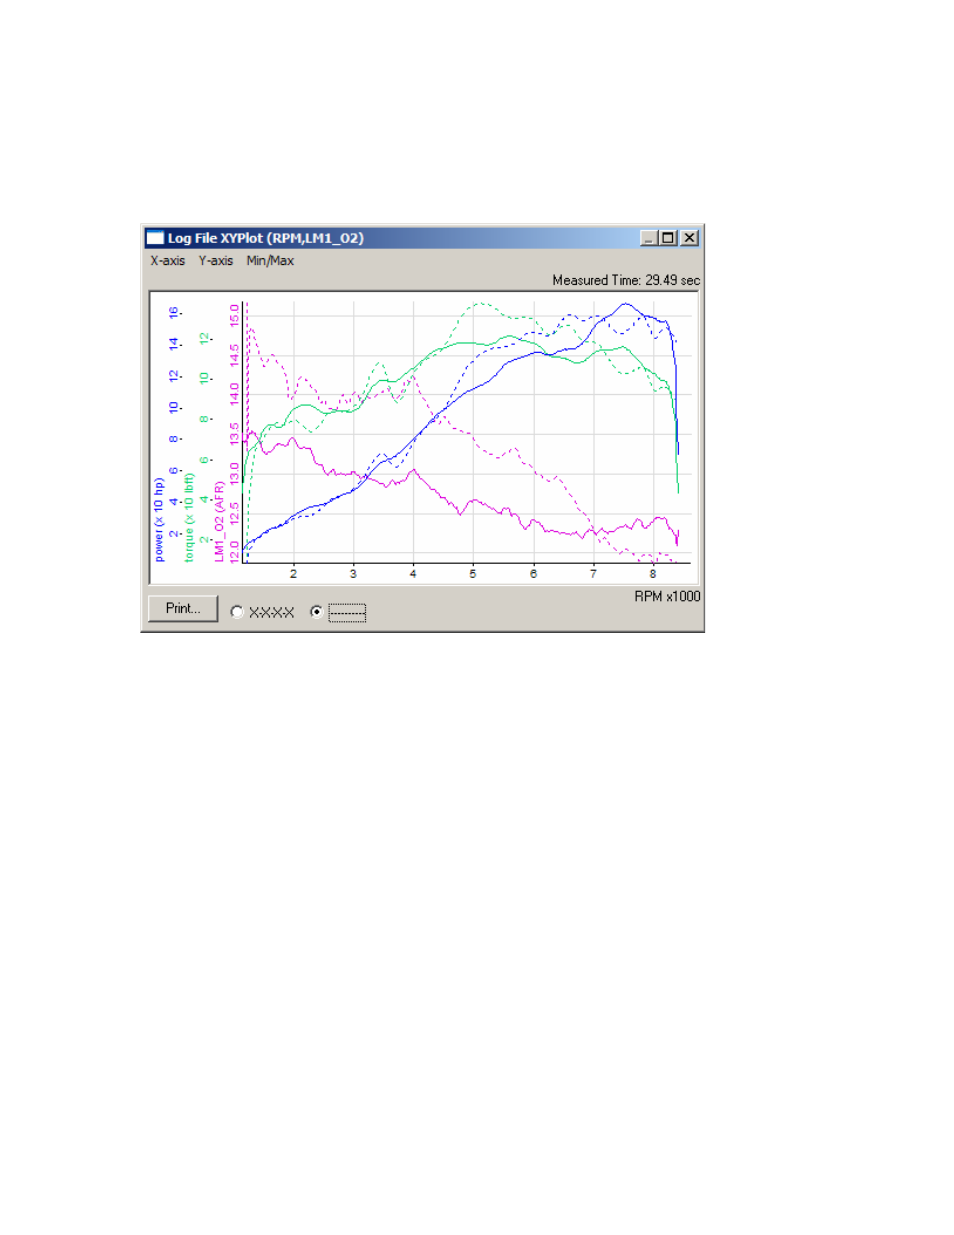
This can be even better analyzed when using the Math Trace Calculator Library and the X-Y Plot
function.For this example all the WOT runs in Session 1..4 in the example file are selected. The
RPM trace is smoothed in those sessions to 1.06 seconds. Then, using the Math library, torque
and horsepower are calculated from gear ratios, tire diameter, cars frontal area, weight and
aerodynamic coefficient, and the RPM slope. The run in Session 3 is overlaid on session one,
and torque, power and AFR together are shown on the X-Y plot:
Again, one can see that at the leaner AFR of the overlaid session the torques are higher, except
at the low RPMs below about 4500. From about 7000 RPM on the overlay torque curve is lower
because the AFR’s are richer than in the original session.
Creating a 3D chart of the torque vs. AFR and RPM dependency for the selected WOT areas
shows what optimum AFR should be used for max power. This chart is created from only 4 runs
(Session 1..4) but illustrates how LogWorks can be used for optimization.
More runs will refine the results.