Watlow EZwarePlus Programming User Manual
Page 42
34
EZwarePlus Programming Manual
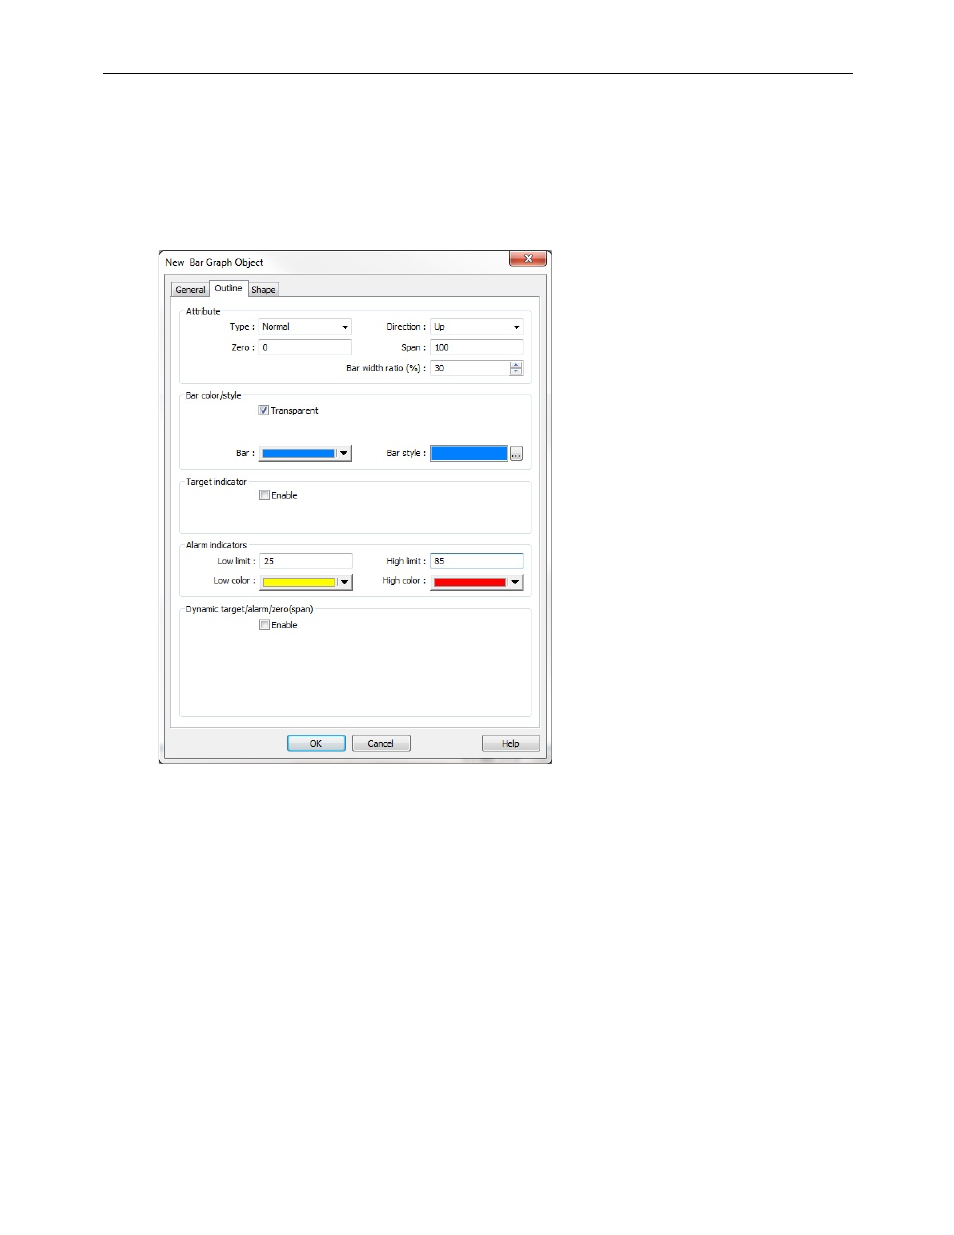
3. Click the Outline tab. In the Attribute section, select the following:
Type: Normal
Direction: Up
Zero: 0 (the register value represented when the bar graph is minimum)
Span: 100 (the register value represented when the bar graph is maximum)
Bar width ratio (%): 30
4. In the Bar color/style section, click the Transparent checkbox. Leave the Bar and Bar style colors at their
default blue.
5. Leave the Target indicator Enable box unchecked.
6. In the Alarm indicators section, select the following:
Low limit: 25
High limit: 85
Low color: yellow (the bar graph color is yellow when the register value is below 25)
High color: red (the bar graph color is red when the register value is above 85)
7. Click the Shape tab. Leave the Use shape checkbox unchecked and click the Use picture checkbox.
1010-1015, Rev. 03
- 12LS Controller (111 pages)
- 8LS Controller (140 pages)
- 8PID Controller (55 pages)
- Addendum to EZwarePlus (50 pages)
- ANASCAN (62 pages)
- ANASOFT (95 pages)
- ANAWIN 2 (154 pages)
- ANAWIN 3 (23 pages)
- Calibrating Watlow Series 988 Family Process Controls (19 pages)
- CAS (98 pages)
- CAS200 (124 pages)
- CLS (180 pages)
- CLS200 (251 pages)
- CLS200, MLS300 and CAS200 (92 pages)
- Control Console (12 pages)
- CPC400 (230 pages)
- DIN-A-MITE Style A (9 pages)
- DIN-A-MITE Style B (14 pages)
- DIN-A-MITE Style C (22 pages)
- DIN-A-MITE Style D (9 pages)
- DIN-Mount Adapter Instruction Sheet, Rev A (1 page)
- Dual DAC (4 pages)
- EM Gateway (28 pages)
- E-Safe Hybrid Relay Rev B (4 pages)
- E-SAFE II Hybrid Power Switch (4 pages)
- EZ-ZONE PM (111 pages)
- EZ-ZONE PM PID (125 pages)
- EZ-ZONE PM Express Limit (34 pages)
- EZ-ZONE PM Express (35 pages)
- EZ-ZONE PM Integrated Controller (181 pages)
- EZ-ZONE RM Limit Module Rev C (127 pages)
- EZ-ZONE RMA Modul (79 pages)
- EZ-ZONE RMC (236 pages)
- EZ-ZONE RME (124 pages)
- EZ-ZONE RMH (161 pages)
- EZ-ZONE RUI/Gateway (62 pages)
- EZ-ZONE RM-Scanner-Modul (140 pages)
- EZ-ZONE ST (97 pages)
- F4 External Event Board - Rev.B (2 pages)
- HG Series Mercury Displacement Relay (6 pages)
- LogicPro (296 pages)
- Mercury Relay or MDR Retrofit (13 pages)
- MICRODIN (24 pages)
- MICRODIN (106 pages)