Bar graph display, Gauge display – Watlow ANAWIN 2 User Manual
Page 86
8-2 AnaWin User’s Guide
Viewing Channels
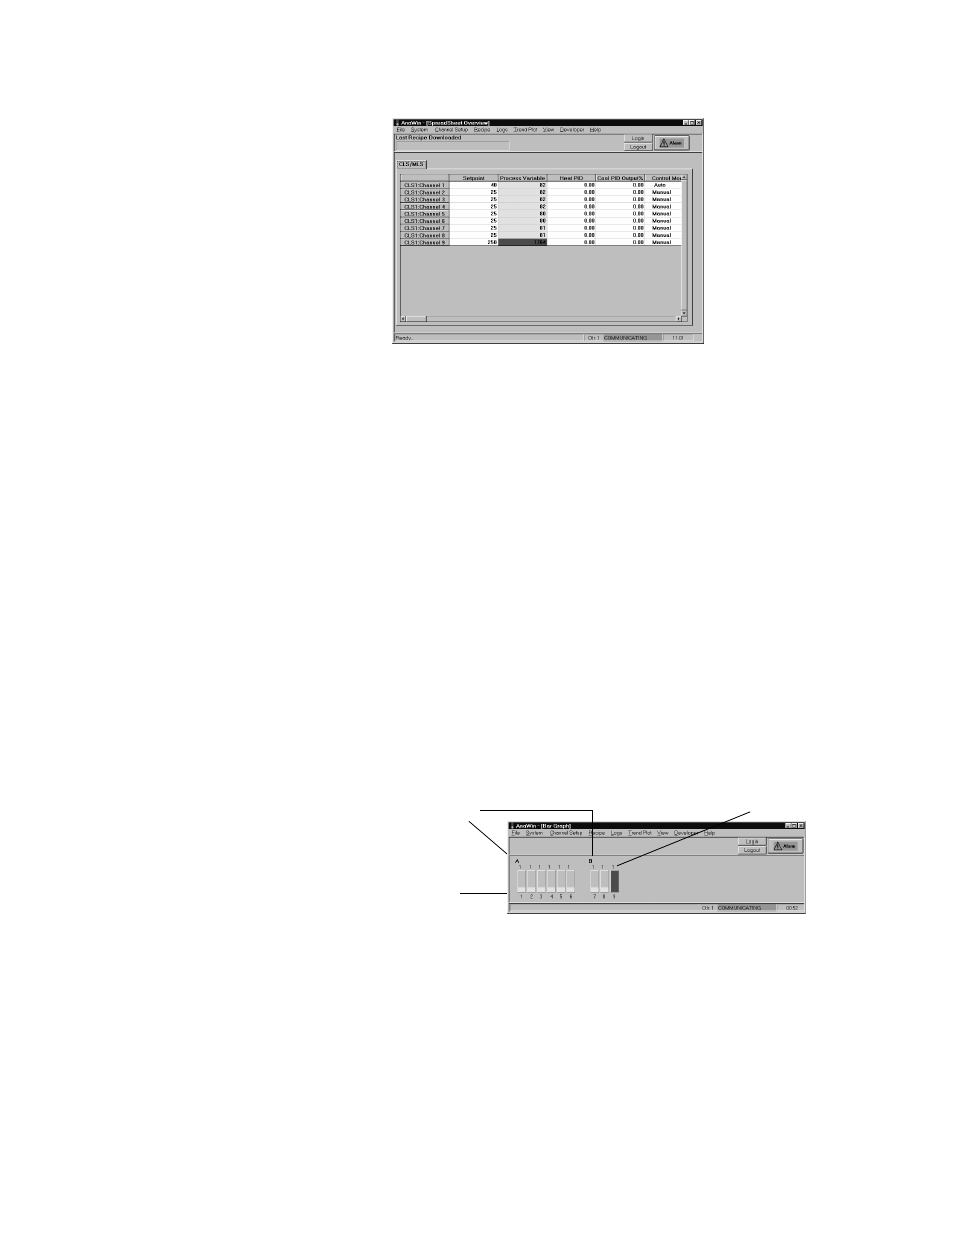
FIGURE 8-1
SpreadSheet Overview Screen
The Process Variable (PV) column displays system status, by color, for
each channel. The color designators are as follows:
Red = The process variable is outside the high process or low process
limits.
Yellow = The process variable is outside the high or low deviation.
Green = The process variable is within deviation band.
Bar Graph Display
Select Bar Graph Display to view channels as a series of small bar
graphs, as shown in Figure 8-2. The bar graphs are updated in real time
and indicate deviation from setpoint with color. If your system has more
than 96 loops, press the Page-Up and Page-Down keys to scroll through
all the loops.
To view the gauge display, double-click the six-channel group you wish
to view or press the associated hotkey letter on your keyboard.
FIGURE 8-2
Bar Graph Display
Gauge Display
The gauge display, shown in Figure 8-3, provides a more detailed view
of the bar graph. Up to six channels are displayed at a time. Press the
Page-Up and Page-Down keys to see other channels.
Hotkeys
Channel
Number
Controller Number