Watlow ANAWIN 2 User Manual
Page 78
7-16 AnaWin User’s Guide
Using the Trend Plot Screen
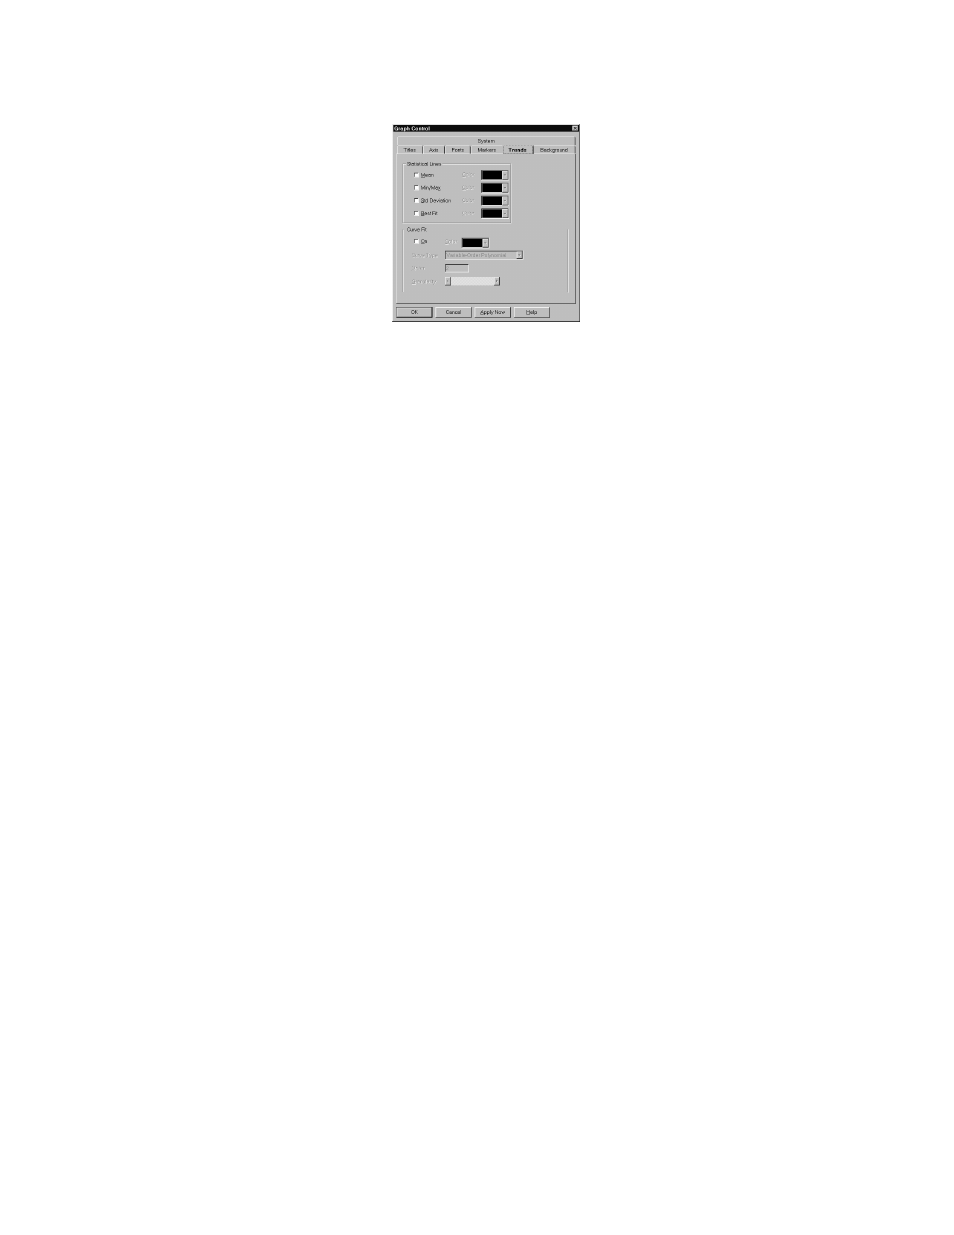
FIGURE 7-11
Trends Property Page
Statistical Lines: Use the options in the Statistical Lines panel to enable
one or more types of statistical lines. You can also set the color of
statistical lines.
If you have enabled an overlay graph, your settings for statistical lines
are applied to it. This may produce two sets of statistical lines on the
same axis, depending on your primary graph type.
•
Mean (default is off): Select Mean to enable a mean line, which is
drawn horizontally through the average value of all data points. Dese-
lect Mean for no mean line. The Mean option applies to scatter, line,
high-low-close and open-high-low-close, candlestick, and box-whis-
ker (parametric data only) graphs. If you have enabled an overlay
graph, your settings for statistical lines are applied to it.
•
Min/Max (default is off): Select Min/Max to enable min and max
lines, which are drawn horizontally through the lowest and highest
data points in a set. Deselect Min/Max for no min and max lines. The
Min/Max option applies to scatter, line, high-low-close and open-
high-low-close, candlestick, and box-whisker (parametric data only)
graphs. If you have enabled an overlay graph, your settings for statisti-
cal lines are applied to it.
•
Std Deviation (default is off): Select Std Deviation to enable a pair of
standard deviation lines, which are drawn horizontally through the
standard deviation from the mean (in both the positive and negative
directions). Deselect StD Deviation for no standard deviation lines. If
you have enabled an overlay graph, your settings for statistical lines
are applied to it.
•
Best Fit (default is off): Select Best Fit to enable a best fit line, which
is a straight line indicating the trend of data points (a first-order poly-
nomial curve). Deselect Best Fit for no best fit line.
•
Color (default): Use the Color pull-down list boxes to choose colors
for statistical lines from the selected color palette. By default, statisti-
cal lines are drawn in the same color as the data sets they apply to. If
you choose a color, it is applied to that type of line (mean, min/max,
standard deviation, or best fit) for all data sets. Use the System prop-
erty page to choose a color palette, as described under “System,” later
in this chapter.