Slope spreadsheet – Watlow ANAWIN 2 User Manual
Page 69
Using the Trend Plot Screen
AnaWin User’s Guide 7-7
Profile data sets: Use the Profile data sets field to set the channel name
for each data set.
Channel selection: Use the Channel selection pull-down list box to
select the profile channels you want to be displayed. The channels you
select are listed in the Profile Channels to be displayed list.
Profile Channels to be displayed: The Profile Channels to be
displayed field lists the profile channels that have been selected for
display.
Select Prof 1: Click Select Prof 1 to display the Select File screen, from
which you can select the first profile file you want to recall.
Select Prof 2: Click Select Prof 2 to display the Select File screen, from
which you can select the second profile file you want to recall.
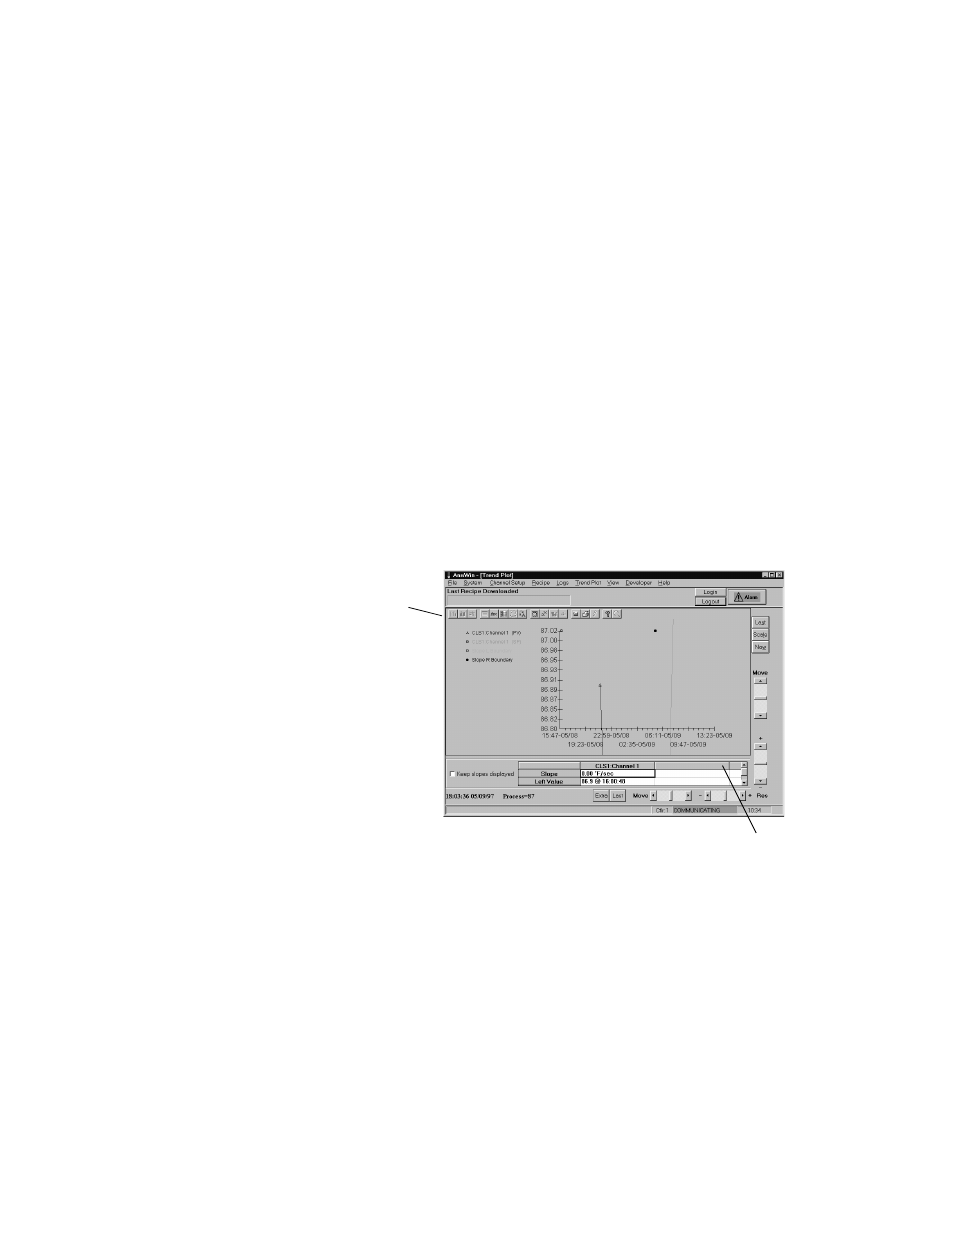
Slope Spreadsheet
To display the slope spreadsheet, click with the right mouse button
anywhere on the trend plot (graph). Figure 7-5 shows a representative
Trend Plot screen displaying the slope spreadsheet.
FIGURE 7-5
Trend Plot Screen with Slope Spreadsheet Displayed
The slope spreadsheet provides a table of slope information for each
channel. Slopes are computed and displayed only for data sets depicting
process variables (not setpoints or output variables). Each column in the
table corresponds to a channel. Use the scroll bar to scroll through the
following rows of data.
Toolbar
Slope Spreadsheet