Fonts – Watlow ANAWIN 2 User Manual
Page 75
Using the Trend Plot Screen
AnaWin User’s Guide 7-13
extend the axis so that it ends on a tick mark. This setting does
not apply when you have set independent positional values.
Grids: The options in the grids panel allow you to enable grid lines for
the X or Y axis and set their style and color.
•
Show (available for X and Y Primary axes only; default is off):
Select Show to draw grid lines perpendicular to the axis, intersecting
each tick mark. Deselect Show for no grid lines.
•
Line Style (default is solid): Use the Line Style pull-down list box to
choose a style for grid lines. The same style is applied to both X and Y
grids.
•
Color (default is automatic black or white): Use the Color pull-
down list box to choose a color for grids from the current palette. The
same color is applied to both X and Y grids. The default color is auto-
matically black or white, whichever provides more contrast. Use the
System property page, as described under “System,” later in this chap-
ter, to choose a different color palette.
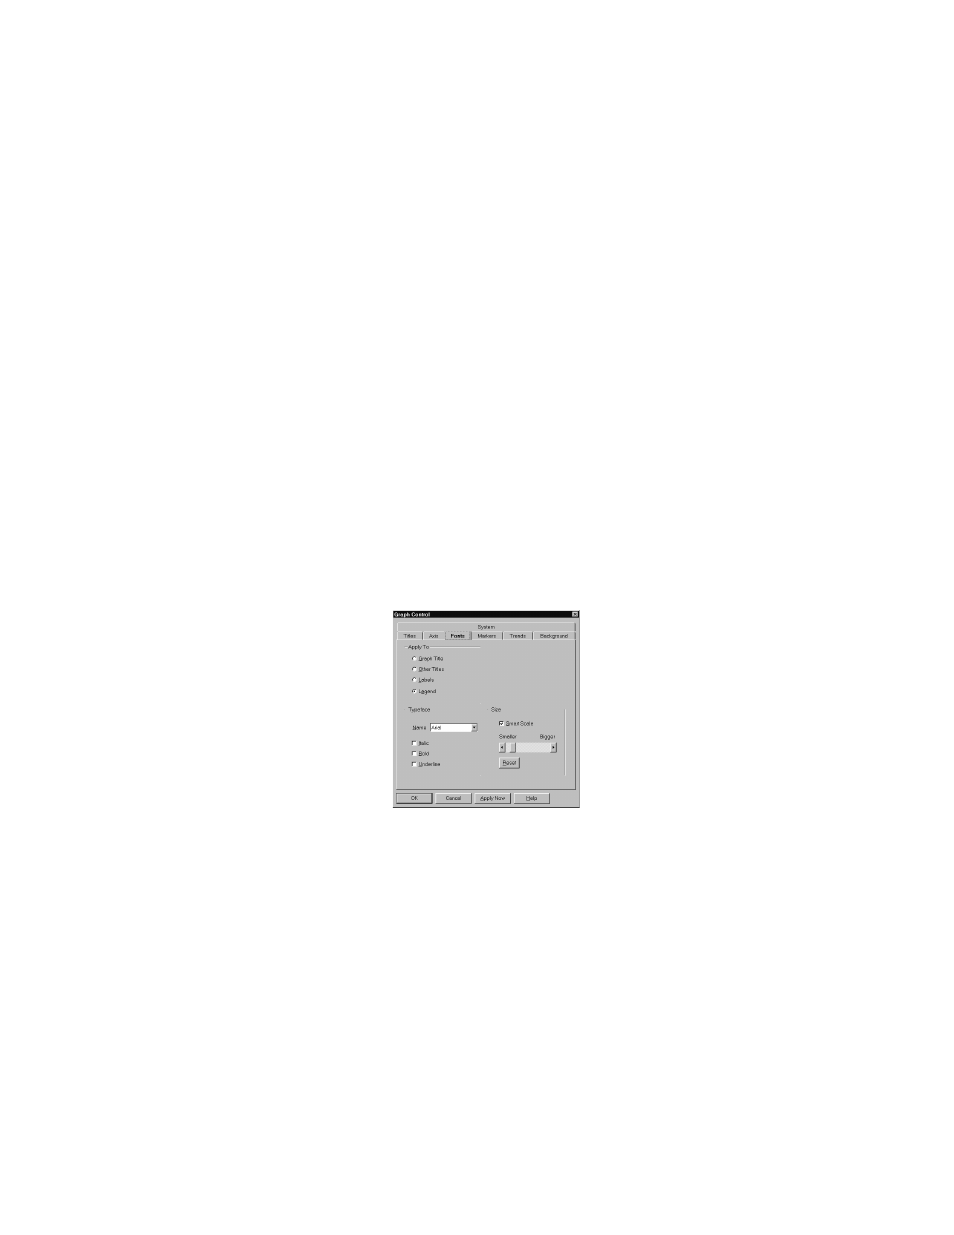
Fonts
Click the Fonts icon to display the Fonts property page shown in
Figure 7-9. This page lets you set the typeface and its style and size for
your graphs titles, labels, and legend.
FIGURE 7-9
Fonts Property Page
Apply To (Fonts): Select an option in the Apply To panel to specify the
text to which you want to apply a font, style, and size.
Typeface: Use the Options in the Typeface panel to select a typeface
and the style in which to display it.
Size: Use the options in the Size panel to select a size for the text.