Trend plot screen features, Plot legend, Trend plot – Watlow ANAWIN 2 User Manual
Page 64: Trend plot adjust buttons
7-2 AnaWin User’s Guide
Using the Trend Plot Screen
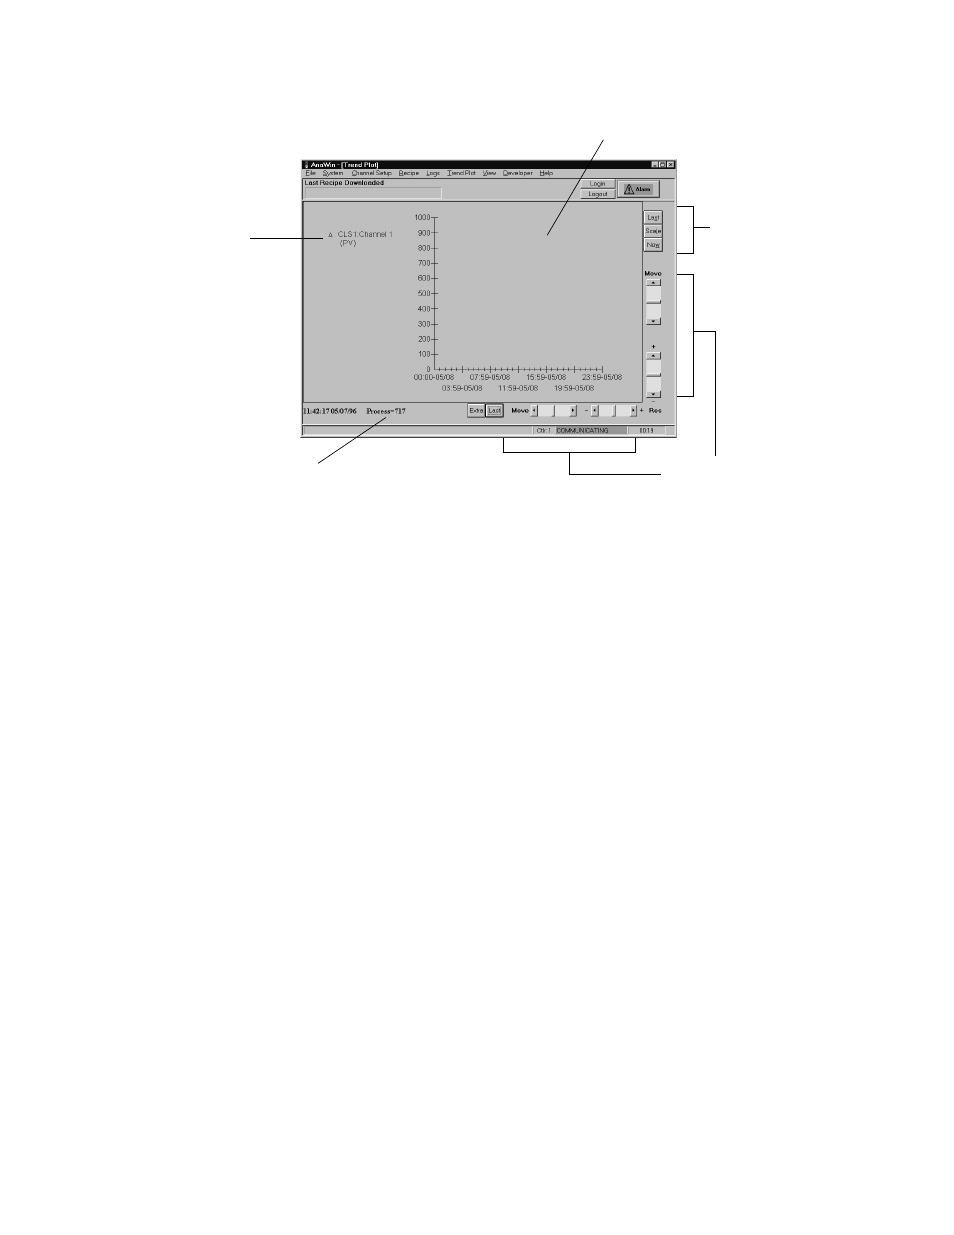
FIGURE 7-1
Trend Plot Screen
Trend Plot Screen Features
The following subsections describe the major features of the Trend Plot
screen.
Plot Legend
The plot legend provides a key relating the colors and symbols used on
the trend plots to the data sets they represent. AnaWin allows you to
plot—and display legends for—up to nine data sets on the Trend Plot
screen. You set up the data sets on the Plot Setup screen. Refer to
“Trend Plot Settings,” later in this chapter, for details.
Trend Plot
The trend plot consists of a curve depicting each data set. Each curve
represents the process variable, setpoint, or output variable for a
channel. You select the data to be graphed on the Plot Setup screen. You
can display up to nine data sets. Refer to “Trend Plot Settings,” later in
this chapter, for details.
Trend Plot Adjust Buttons
The buttons in the upper right corner of the Trend Plot screen allow you
to adjust the vertical axis of the trend plot. Controls along the bottom of
the screen allow you to adjust the horizontal axis of the trend plot.
Trend Plot
Trend Plot
Adjust
Buttons
Trend Plot Adjust
Scroll Bars
Time and Process Variable Values
at Pointer (Mouse) position
Plot Legend