Toolbar, Titles – Watlow ANAWIN 2 User Manual
Page 70
7-8 AnaWin User’s Guide
Using the Trend Plot Screen
Slope: The Slope row lists the slope at the point where you clicked on
the trend plot on the Trend Plot screen.
Left Value: The Left Value row lists the time and process variable value
of the left hand point used for the slope calculation.
Right Value: The Right Value row lists the time and process variable
value of the right hand point used for the slope calculation.
Keep slopes displayed: Click Keep slopes displayed to keep the slope
spreadsheet displayed on the Trend Plot screen when you use the scroll
bars.
Toolbar
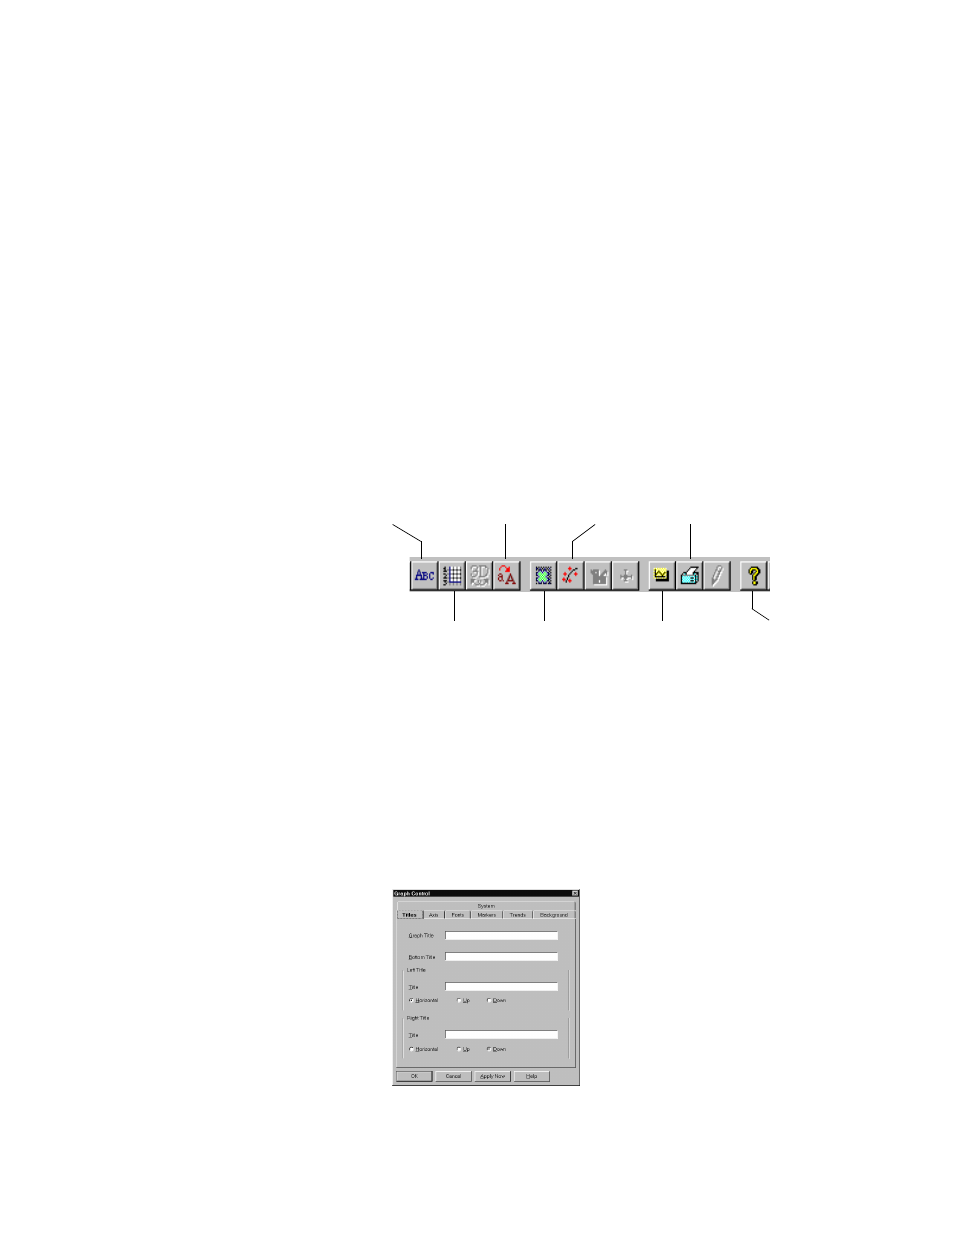
The Trend Plot screen toolbar, shown in Figure 7-6, allows you to
access property pages from which you can specify setup parameters for
trend plots. The toolbar appears above the trend plot graph when the
Display Tool Bar option is selected on the Trend Plot Settings screen.
FIGURE 7-6
Trend Plot Screen Toolbar
Some icons in the toolbar are not used by AnaWin and are grayed-out.
The following subsections describe the available icons. To return to the
Trend Plot screen from a property page, click OK.
Titles
Click the Titles icon to display the Titles property page, shown in
Figure 7-7, on this page you can enter text titles for your graph. You can
place titles at the top, bottom, left or right of the graph.
FIGURE 7-7
Titles Property Page
Titles
Axis
Fonts
Markers
Trends
Background
System
Help