Watlow ANAWIN 2 User Manual
Page 72
7-10 AnaWin User’s Guide
Using the Trend Plot Screen
FIGURE 7-8
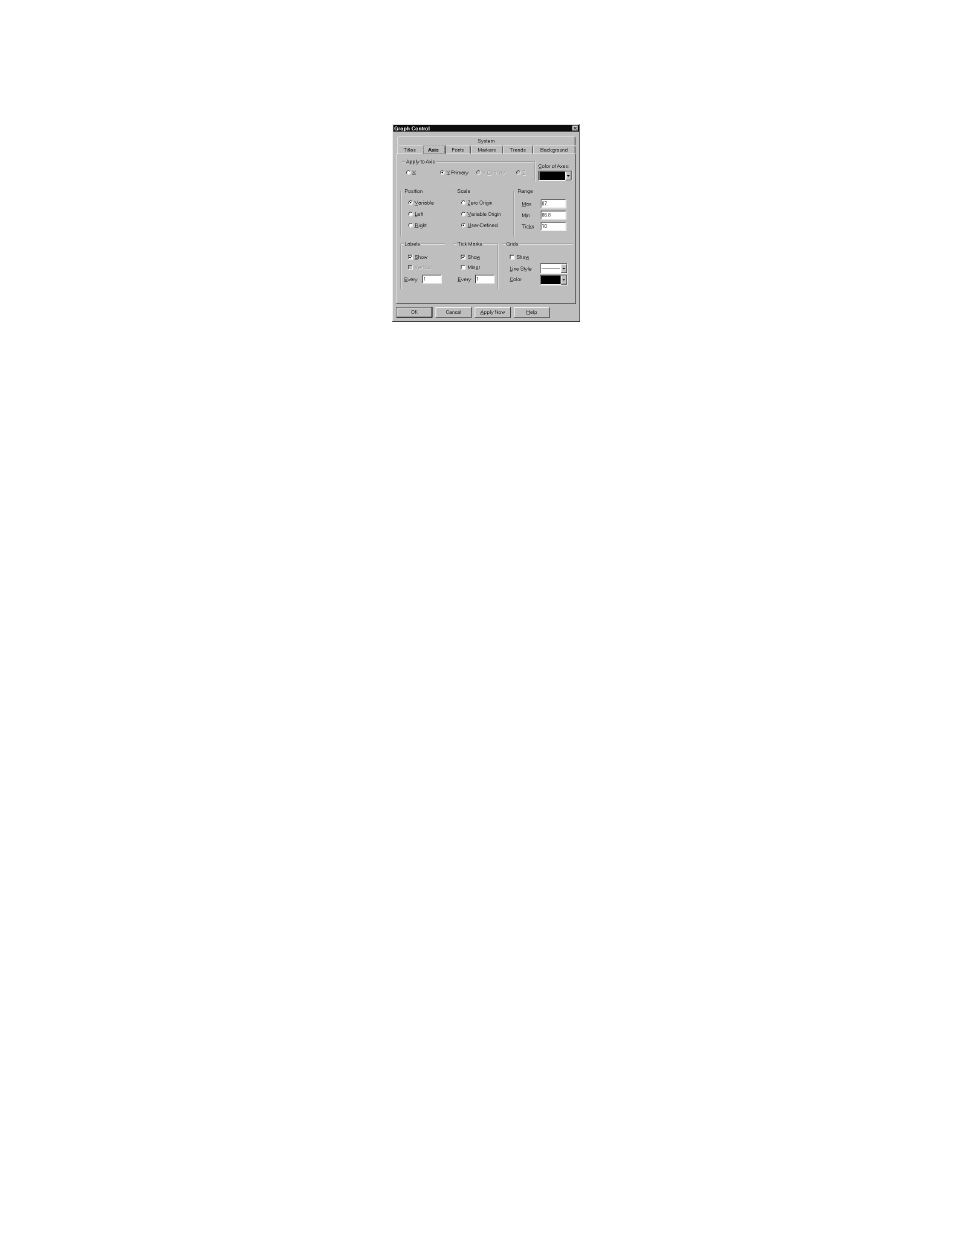
Axis Property Page
Apply to Axis: Select an option from the Apply to Axis panel to specify
the axis to which you want your settings to apply: X, Y Primary, or
Y Overlay. The Y Overlay axis is used for the output variables, which
are read on the right-hand vertical axis.
Position: The options in the position panel vary according to the axis
selected in the Apply to Axis panel. You cannot set the position options
for the Y overlay axis because that axis is always drawn at the right and
bottom right respectively.
•
Variable (default): When X is selected in the Apply to Axis panel,
select Variable to draw the X-axis intersecting the Y origin, either at
the top, bottom, or middle of the graph. When Y Primary is selected in
the Apply to Axis panel, select Variable to draw the primary Y axis
intersecting the X origin, either at the left, right, or middle of the
graph.
•
Top or Left: When X is selected in the Apply to Axis panel, select Top
to draw the X-axis at the top of the graph, regardless of the location of
the Y origin. When Y Primary is selected in the Apply to Axis panel,
select left to draw the primary Y axis at the left edge of the graph,
regardless of the location of the X origin.
•
Bottom or Right: When X is selected in the Apply to Axis panel,
select Bottom to draw the X axis at the bottom of the graph, regardless
of the location of the Y origin. When Y Primary is selected in the
Apply to Axis panel, select Right to draw the primary Y axis at the
right edge of the graph, regardless of the location of the X origin.
Color of Axes (default is automatic black or white): Use the Color of
Axes pull-down list box, to choose a color for axes from the current
color palette. The same color is applied to all axes. The default color is
automatically black or white, whichever provides more contrast. Use the
System property page, as described under “System” later in this chapter,
to choose a new color palette.