System – Watlow ANAWIN 2 User Manual
Page 81
Using the Trend Plot Screen
AnaWin User’s Guide 7-19
•
Background Color (default is light gray): Use the Background
Color pull-down list box to choose a background color for the graph-
ing window from the current color palette. Use the System property
page to choose a color palette, as described under “System,” later in
this Chapter.
•
Backdrop (default is None): Use the Backdrop pull-down list box to
choose a type of graphic image (bitmap, metafile or none) to use for
the backdrop of the graphing window. You can also choose how the
image is displayed—centered, tiled, or stretched.
•
File: Use the File field to enter the filename for the graph's backdrop
image. If you do not include a path to the file as part of this string, the
Graph Control searches the current directory. The appropriate file
extension (.BMP or.WMF) is added automatically, according to your
selection in the Backdrop list box.
•
Browse: Click Browse if you want to call up a standard Windows
Open dialog to locate a backdrop file.
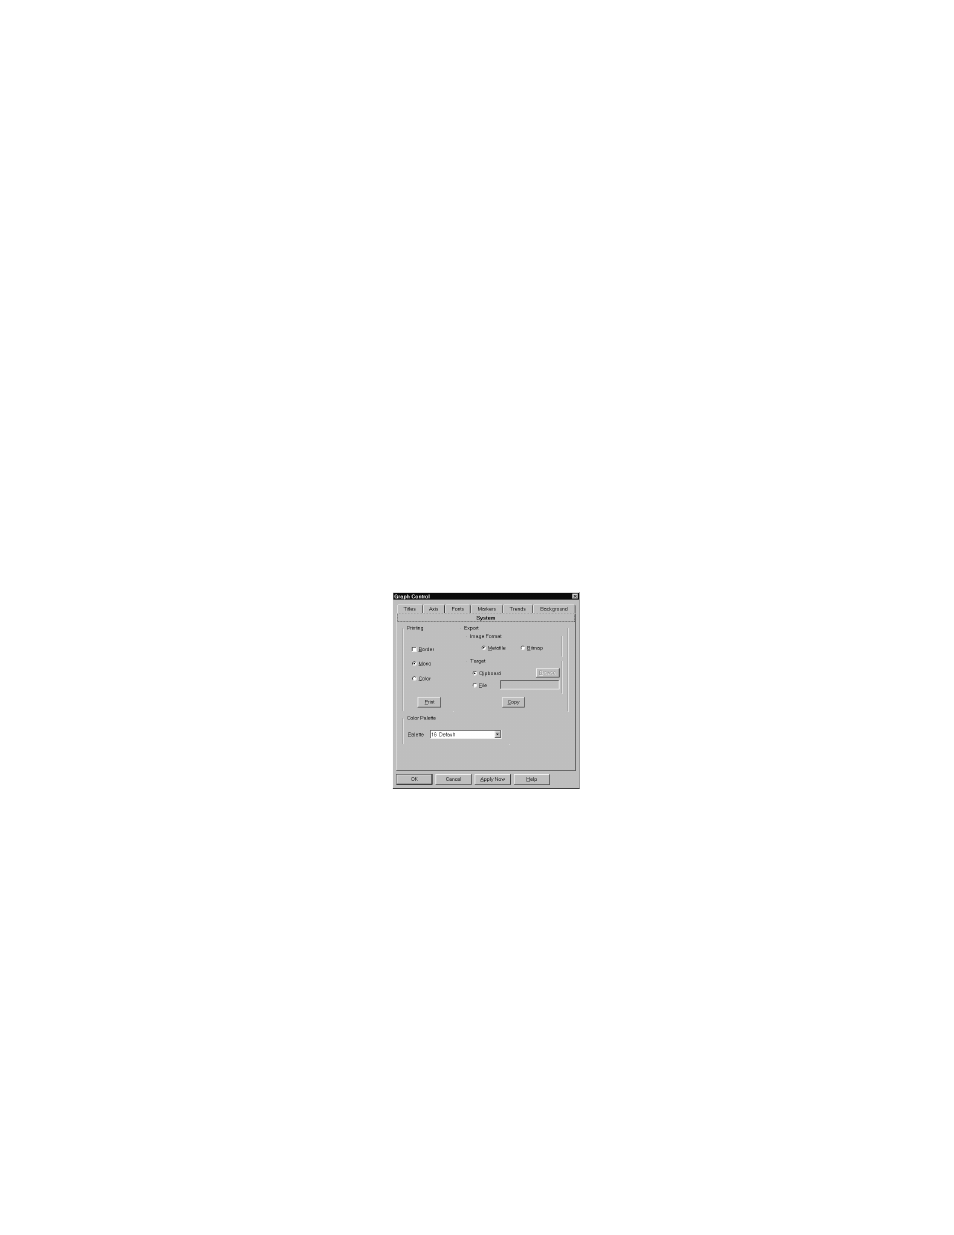
System
Click the System icon to display the System property page, shown in
Figure 7-13. This page allows you to set printing parameters, export a
copy of the trend plot, and choose a color palette.
FIGURE 7-13
System Property Page
Printing: Use the options in the Printing panel to set print parameters
and print a plot. To plot data other than the defaults, configure each data
set individually, as described below.
•
Border (default is off): Select Border to include a border around the
graphing window when you print it. Deselect Border for no border.
•
Mono (default): Select Mono to print in monochrome, with a white
background and black objects. The Graph Control supplies varying
patterns, symbols, and line thicknesses to differentiate data sets and
points from each other.
•
Color: Select Color to print in color or grayscale. The graphing win-
dow is printed as it appears on the screen.