Begin report, End report – Watlow ANAWIN 2 User Manual
Page 24
3-2 AnaWin User’s Guide
Exporting Data
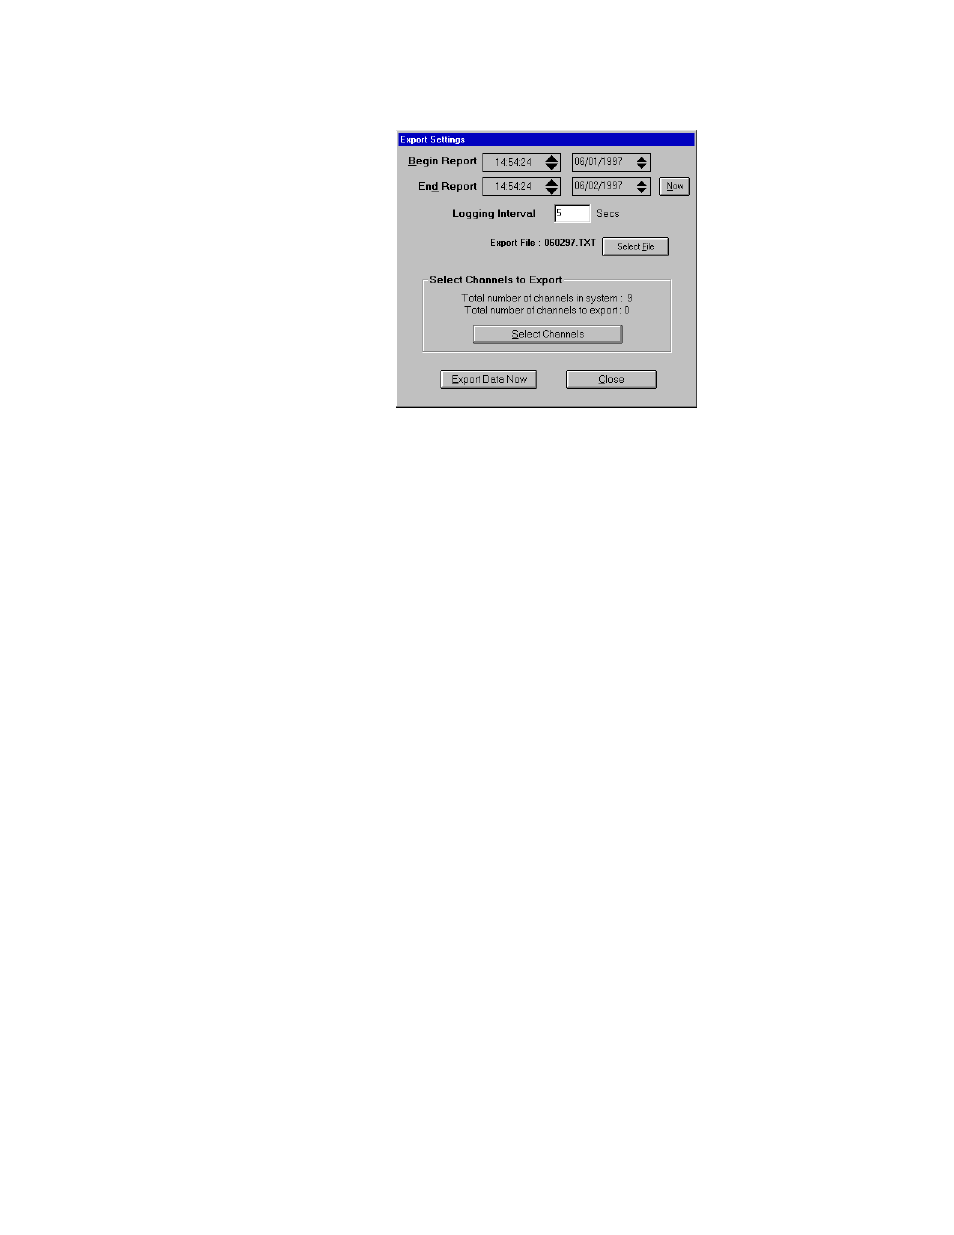
FIGURE 3-1
Export Settings Screen
Setpoint, process variable, and heat and cool output power are logged
whenever AnaWin communicates with one or more controllers. The
maximum sampling frequency is determined by the parameters set
through the Trend Plot menu. Refer to “Trend Plot Settings.” in Chapter
7, for information on how to set the frequency for data collection.
Set the following parameters on the Export Settings screen to set up
export to a database file.
Begin Report
Use the Begin Report fields to define the time (Hours, minutes, seconds)
and the day (day, month, year) serving as the starting point of your data
log file. The time is in 24-hour format.
To change a value, either overtype the existing value using the keyboard
or move the cursor to the left of the value you want to change and click
on the up/down arrows to increase or decrease the values.
End Report
Use the End Report fields to define the time (Hours, minutes, seconds)
and the day (day, month, year) serving as the ending point of your data
log file.
Click on the up/down arrows to the right of the value you want to
change, and to increase or decrease the values.
Now
If you want your data logging file to end at the current moment, click
Now instead of using the up/down arrows.