Chapter 10 – bar graphs, meters, and trends, Creating bar graphs – Maple Systems HMI5000 Series User Manual
Page 158
152
EZware5000 Series Programming Manual
1010-1007, Rev. 10
Chapter 10 – Bar Graphs, Meters, and Trends
This chapter focuses on three special graphic objects, which can be used to display PLC data registers. You’ve learned
how to use shapes and bitmaps to represent the data in PLC registers as states. You’ve also learned how to use
alphanumeric data fields to display the contents of PLC registers as either numbers or ASCII characters. We now
introduce three more options to display the data in PLC registers:
Bar Graph Objects
Trend Display Objects
Meter Display Objects
Creating Bar Graphs
The Bar Graph Object is used to represent the data in a 16-bit or 32-bit PLC register as a bar graph. You can configure
the bar graph to move up, down, right, or left. The bar graph can be configured with any base number that represents
0 level and any span range. You can create the bar graph with an alarm low and high setting to indicate to the HMI
operator that an underflow/overflow alarm condition exists. In addition, you can set the alarm low and high limits to
be controlled by two additional PLC registers so that the low and high limits are variable. Bar graphs can even be
constructed with a shape or bitmap overlaying the bar graph to create flow tanks, temperature gauges, etc.
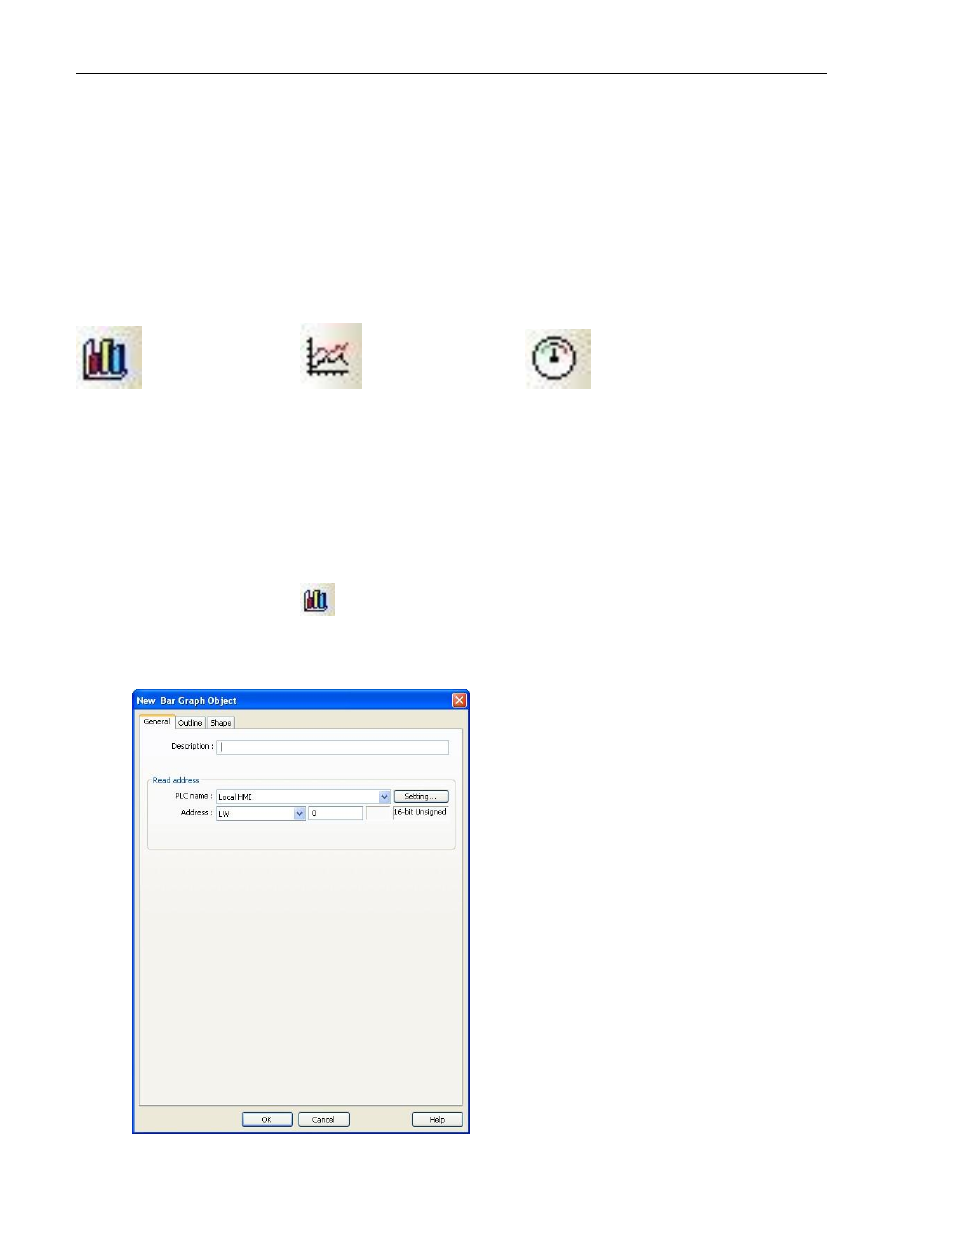
To create a Bar Graph Object:
1. From the Objects menu, click Bar Graph, or click the Bar Graph icon in the Object 2 toolbar. The New Bar
Graph Object dialog box appears.