6 dashboard view – Teledyne LeCroy Summit T3-8 PCIe Multi-lane Protocol Analyzer User Manual User Manual
Page 48
Teledyne LeCroy
Dashboard View
36
Summit T3‐8 PCI Express Multi‐Lane Protocol Analyzer User Manual
4.6 Dashboard
View
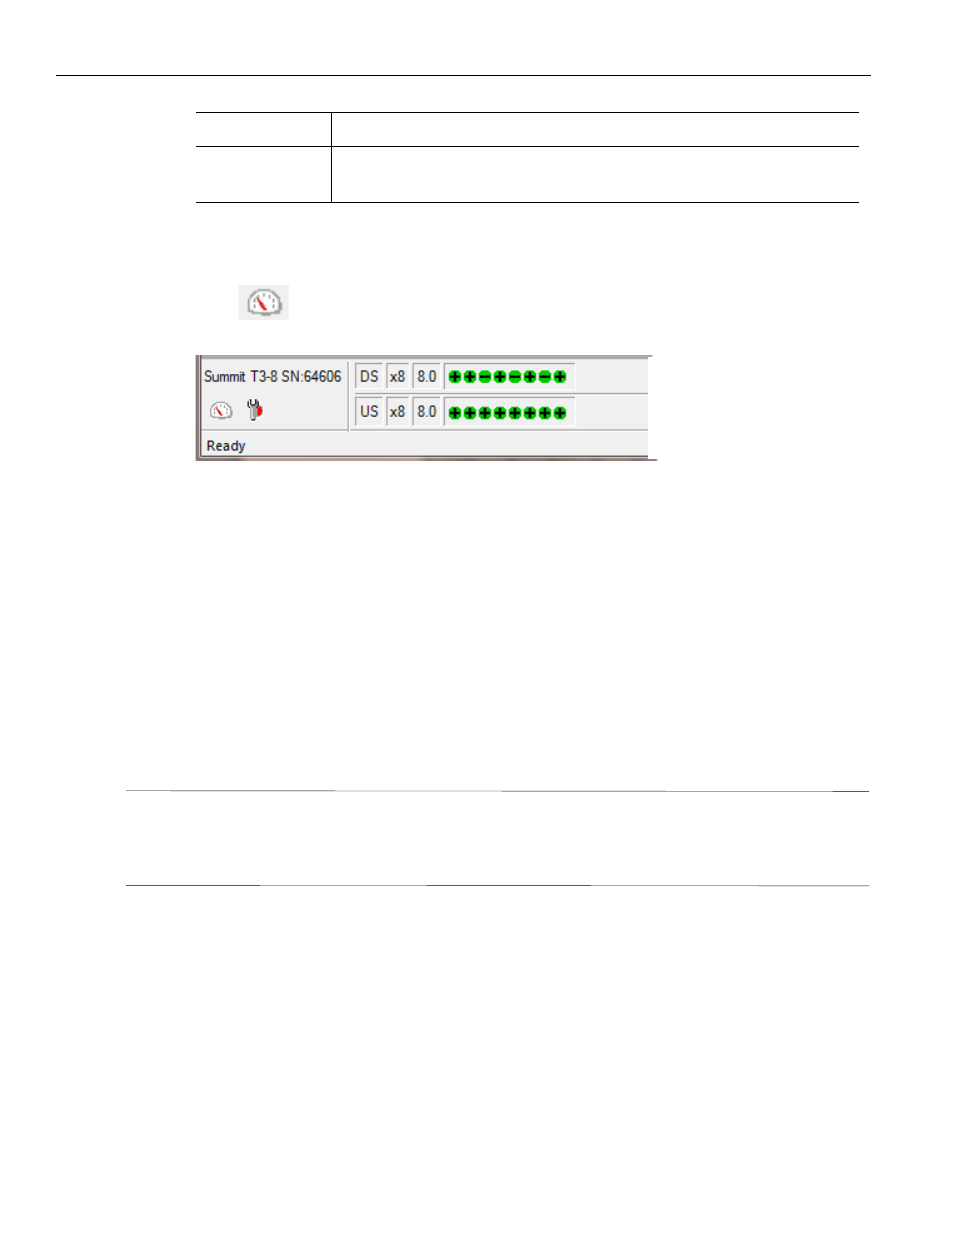
Dashboard View shows state of the link that analyzer is tracking. Click the Dashboard
View
icon to view the Dashboard View window for the selected device.
Figure 4.4: Dashboard View Icon Displaying Device
Dashboard (see
) displays the following information for Upstream
and Downstream:
Link Width
Link speed
Per lane activity indication
Green ‐ lane is active, analyzer does not detect any signal errors on this lane
Orange ‐ lane is active, analyzer detects signal errors on this lane
Grey ‐ lane is inactive
Logical to physical lane mapping
Lane polarity
Link Number
NFTS ‐ The number of FTS advertized by the device for each speed
Note:
The dashboard display depends on the Recording Options configuration and may
not match the current actual link state. For example, if the analyzer is configured to
track 2.5 GT/s speed only, the Dashboard View will display 2.5GT/s speed as a
current tracking speed regardless of the actual speed of the link.
Shortcuts List
Displays a list of Keyboard shortcuts.
About PETracer
Displays version information about the attached Analyzer and its
Firmware and BusEngine™.