3 real-time statistics graph areas – Teledyne LeCroy Summit T3-8 PCIe Multi-lane Protocol Analyzer User Manual User Manual
Page 232
Teledyne LeCroy Corporation
Real‐Time Statistics Window
220
Summit T3‐8 PCI Express Multi‐Lane Protocol Analyzer User Manual
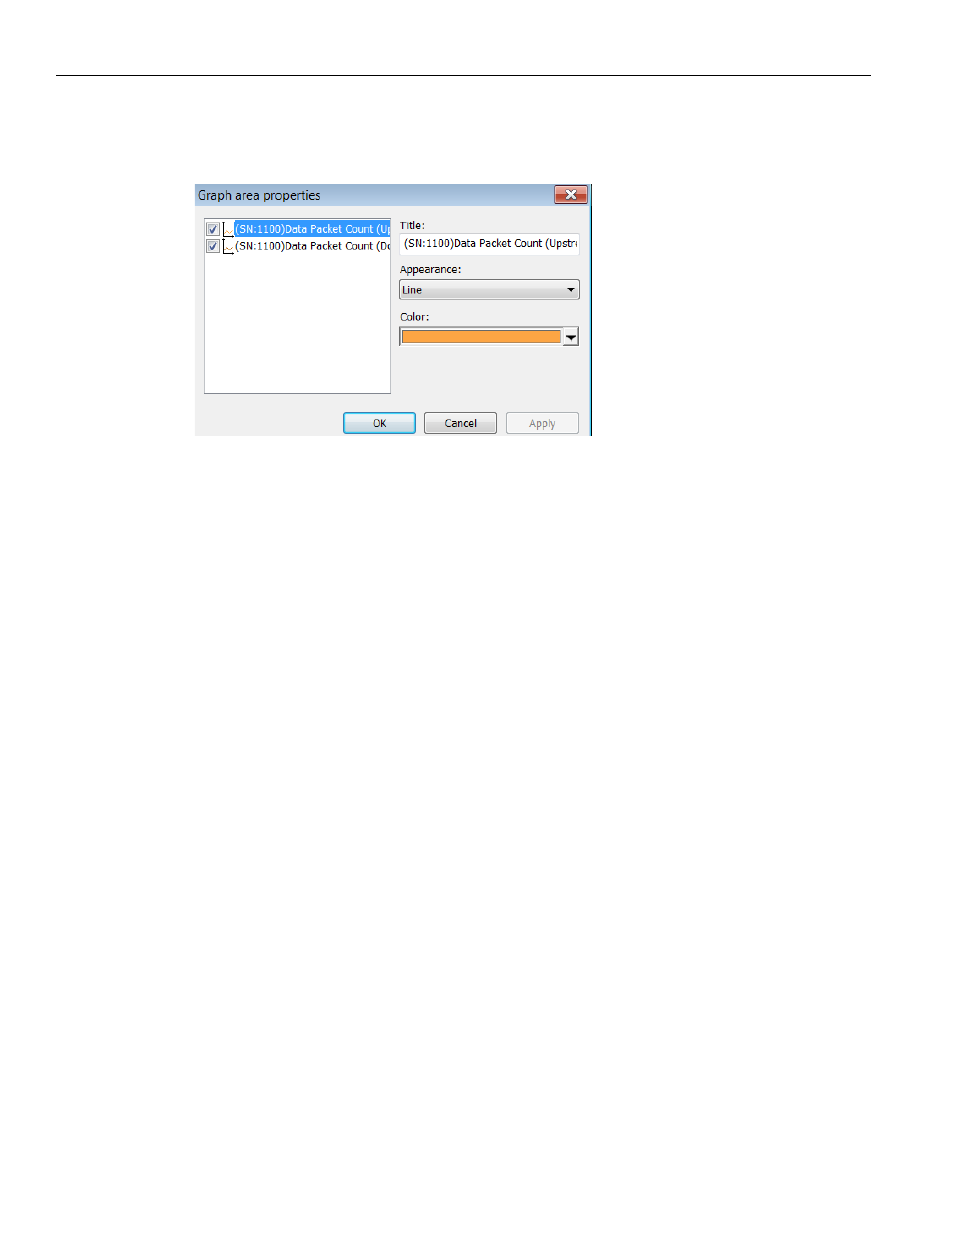
Properties: Opens a dialog box with options for changing the Title, Appearance, and Color
of the graph.
Figure 10.30: Graph Area Properties Display
10.19.3 Real-Time Statistics Graph Areas
The Real‐time Statistics window has three graph areas:
Link Utilization
Data Payload Throughput
Data Packet Count
Each graph area has Upstream and Downstream graphs for a device (if connected to a
PC), plus as many graphs as Exerciser devices connected to the PC.
The Statistics Accumulation area shows the PETracer statistics tab, plus as many tabs as
Exerciser devices connected (see
See also other documents in the category Teledyne LeCroy Equipment:
- 6Zi Rackmount (12 pages)
- HDO Oscilloscope Rackmount (14 pages)
- LSIB-1 Host Interfaces (44 pages)
- OC1021 Oscilloscope Cart (9 pages)
- OC1024 Oscilloscope Cart (10 pages)
- OC910 Oscilloscope Cart (2 pages)
- TTL-AUX-OUT (1 page)
- WaveJet Rackmount (1 page)
- Zi Oscilloscope Rackmount (12 pages)
- USB2-GPIB (12 pages)
- WM8Zi-2X80GS (2 pages)
- WR6ZI-8CH-SYNCH (6 pages)
- Zi Oscilloscope Synchronization ProBus Module (Zi-8CH-SYNCH) (16 pages)
- LogicStudio (42 pages)
- WaveSurfer MXs-B Getting Started Manual (126 pages)
- WaveSurfer MXs-B Quick Reference Guide (16 pages)
- X-STREAM OSCILLOSCOPES Remote Control (305 pages)
- WS-GPIB (12 pages)
- PXA125 (219 pages)
- PXD Series (42 pages)
- PXD222 (38 pages)
- Oscilloscope System Recovery (8 pages)
- LabMaster 9Zi-A (264 pages)
- LabMaster 10Zi Rackmount (8 pages)
- LabMaster 10Zi Getting Started Manual (236 pages)
- LabMaster 10Zi Operators Manual (198 pages)
- WaveAce 1000_2000 (108 pages)
- WaveAce 1000_2000 Remote Control (92 pages)
- WaveRunner Xi-A Quick Reference Guide (16 pages)
- WaveRunner XI SERIES Operator’s Manual (233 pages)
- WaveMaster Automation Command (667 pages)
- WaveMaster 8 Zi_Zi-A (190 pages)
- WaveMaster 8000A (46 pages)
- WavePro 7 Zi_Zi-A (188 pages)
- WaveExpert series Automation Manual (285 pages)
- WaveExpert 9000_NRO9000_SDA100G Getting Started Manual (50 pages)
- WaveExpert 100H Operators Manual (348 pages)
- WaveRunner Automation Command (460 pages)
- WaveRunner Xi-A Getting Started Manual (128 pages)
- WaveRunner 6 Zi and 12-Bit HRO Getting Started Manual (198 pages)
- WaveRunner 6 Zi Quick Reference Guide (20 pages)
- WaveRunner 6 Zi-ExtRef-IN_OUT (2 pages)
- WaveSurfer Automation Command (226 pages)
- HDO 4000 Getting Started Guide (48 pages)
- HDO Removable Hard Drive (2 pages)