1 unit-based averaging – Teledyne LeCroy Summit T3-8 PCIe Multi-lane Protocol Analyzer User Manual User Manual
Page 226
Teledyne LeCroy Corporation
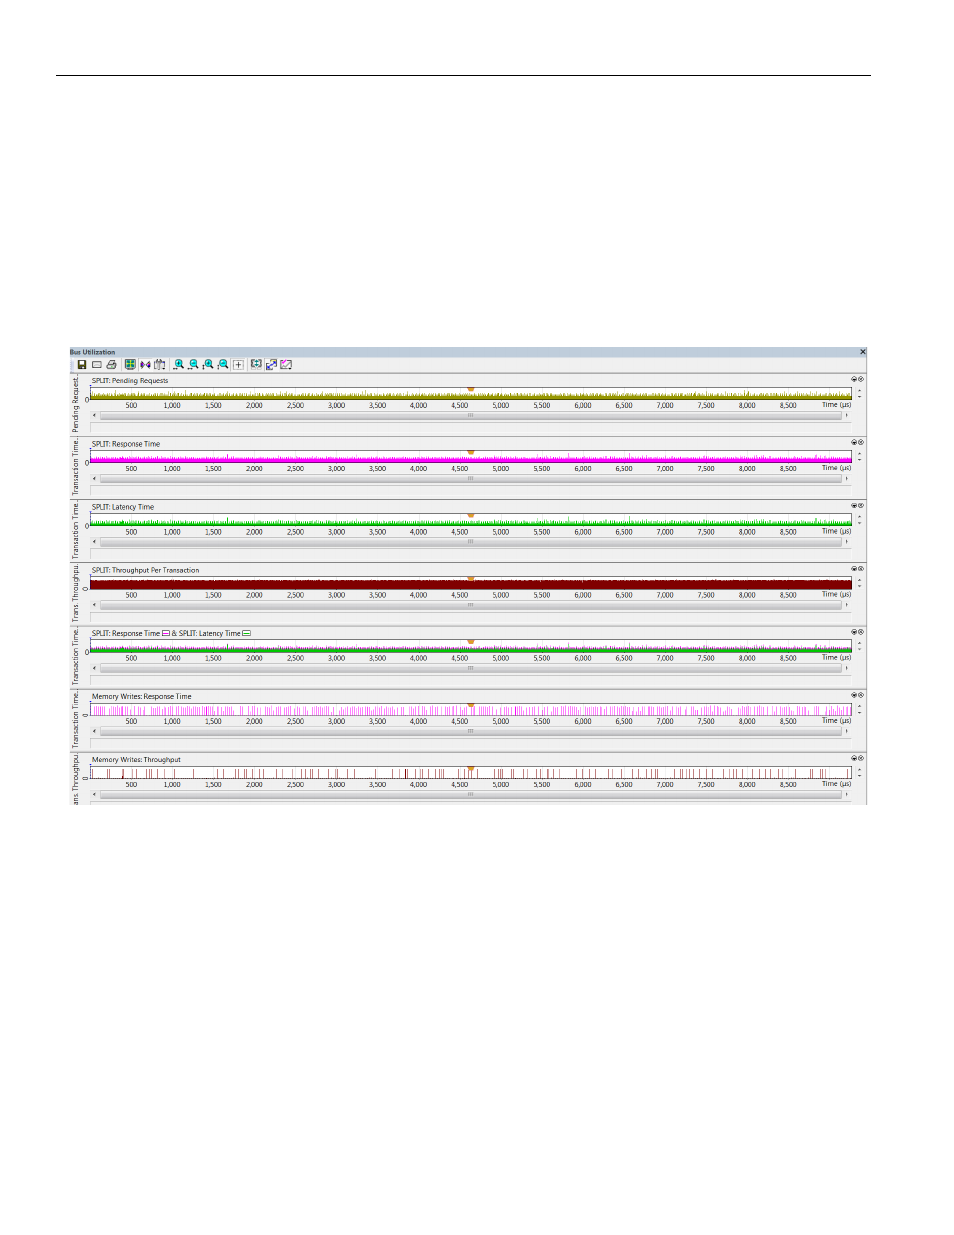
Show Metrics in the Bus Utilization Window
214
Summit T3‐8 PCI Express Multi‐Lane Protocol Analyzer User Manual
2. Response Time at Split Transaction level.
3. Latency Time at Split Transaction level.
4. Throughput Per Transaction at Split Transaction level.
5. Response Time and Latency Time at Split Transaction level (combined graph).
6. Response Time at Link Transaction level, for Memory Writes only.
7. Throughput at Link Transaction level, for Memory Writes only.
The following is an example of Bus Utilization window display of graph numbers 1, 4, 5, 6
and 7 (see following figure):
10.18.1 Unit-Based Averaging
The Analyzer builds metric graphs using unit‐based averaging (as opposed to time‐based
averaging). For the total duration of a certain request (or Memory Write transaction), the
graph value is assumed equal to the corresponding metric for this request (transaction). If
there are overlapping operations for a certain time period, then the value is calculated as
an average of metric values for all the overlapped requests (transactions).
It is important to remember that the Analyzer uses unit‐based averaging rather than
time‐based averaging. Time‐based averaging can be misleading in some situations. For
example, consider the Throughput Per Transaction graph. Sometimes, while many
outstanding requests are in progress, latency (and response time) grows for each of the
transactions, resulting in a lower throughput per transaction over time (which is reflected
in the graph). This happens even though aggregated throughput across all the
transactions is constant.