5 - toolbar buttons, Toolbar buttons 5 – Measurement Computing eZ-Analyst rev.14.1 User Manual
Page 93
eZ-Analyst
916994
Toolbar Buttons 5-1
Toolbar Buttons
5
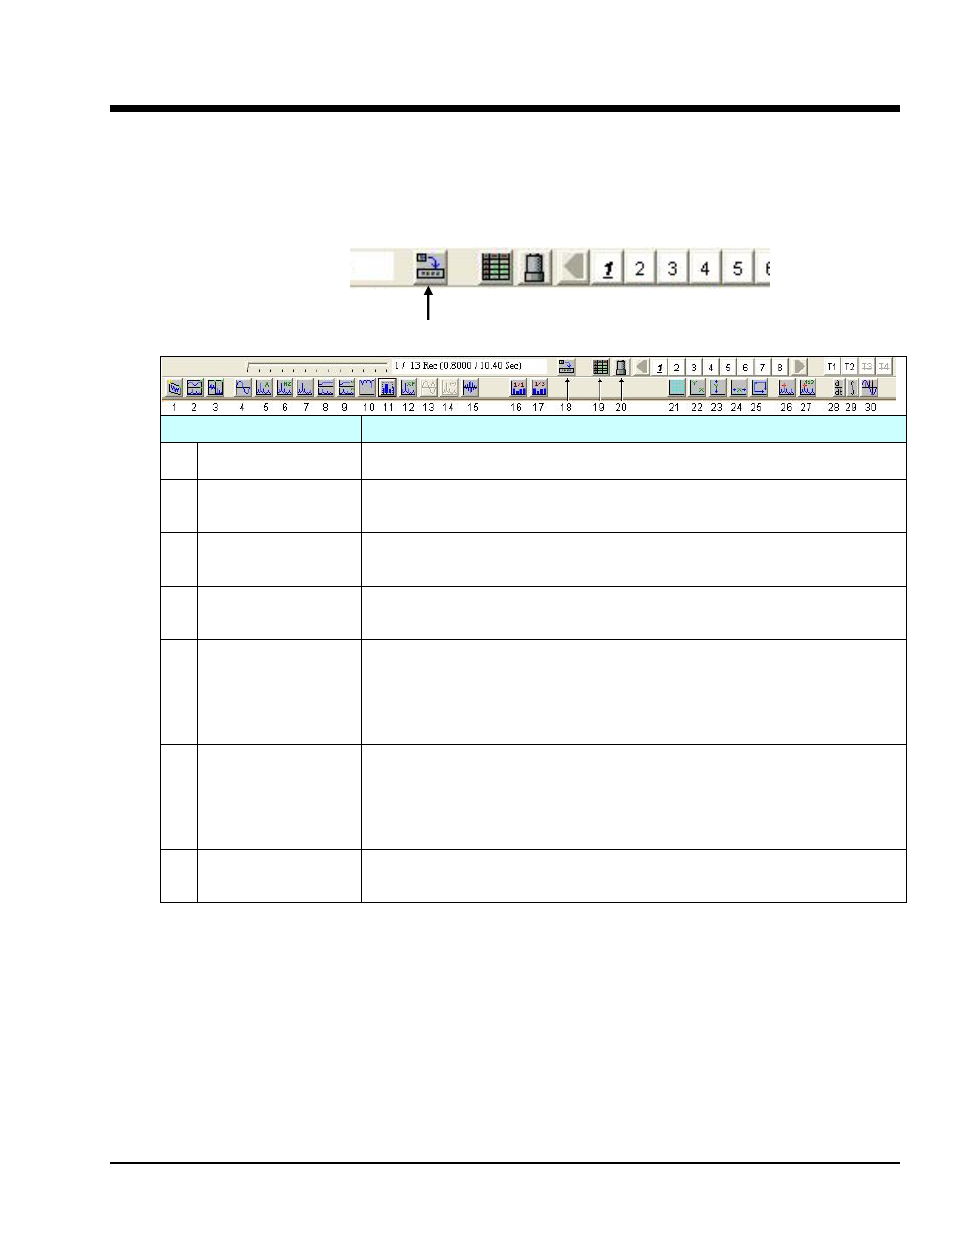
Clicking the “Graph Toolbar” button will bring up a buttons toolbar, which provides a means of
quickly implementing various plot display functions. An alternative to using the buttons is to
“right-click” in a plot display, then use the resulting function menu. When the graphic toolbar
is open, clicking the button again will close it.
Graphic Toolbar Button
Function
Description / Comments
1
Add New FV Window Adds a new Function View.
2
Tile Horizontally
Tiles two or more Function Views such that they are longer in the
horizontal direction.
3
Tile Vertically
Tiles two or more Function Views such that they are longer in the vertical
direction.
4
Time
A single-channel display function. Displays a time domain waveform of
sampled data scaled in either Volts or EUs.
5
Auto-Spectrum
A single-channel display function. Displays the square of the magnitude
of the complex (one-side) Fourier spectrum of x(t). Autospectra are
calibrated so that if A is the peak amplitude of a sinusoidal signal x(t),
then the autospectrum has the value A*A (or use A power 2) at the
sinusoidal frequency.
6 PSD
(Power Spectral
Density)
Power Spectral Density (PSD) displays the power of random vibration
intensity as “mean-square acceleration per frequency unit.” PSD is a
single-channel display function. It is the Fourier Transform of the Auto-
correlation function. This normalization should be used with continuous
random signals.
7
Spectrum
A dual-channel display function. Displays averaged linear spectrum
computed as the square root of the averaged autospectrum.