Measurement Computing eZ-Analyst rev.14.1 User Manual
Page 109
eZ-Analyst
988191
Interactive Plot Display 6-7
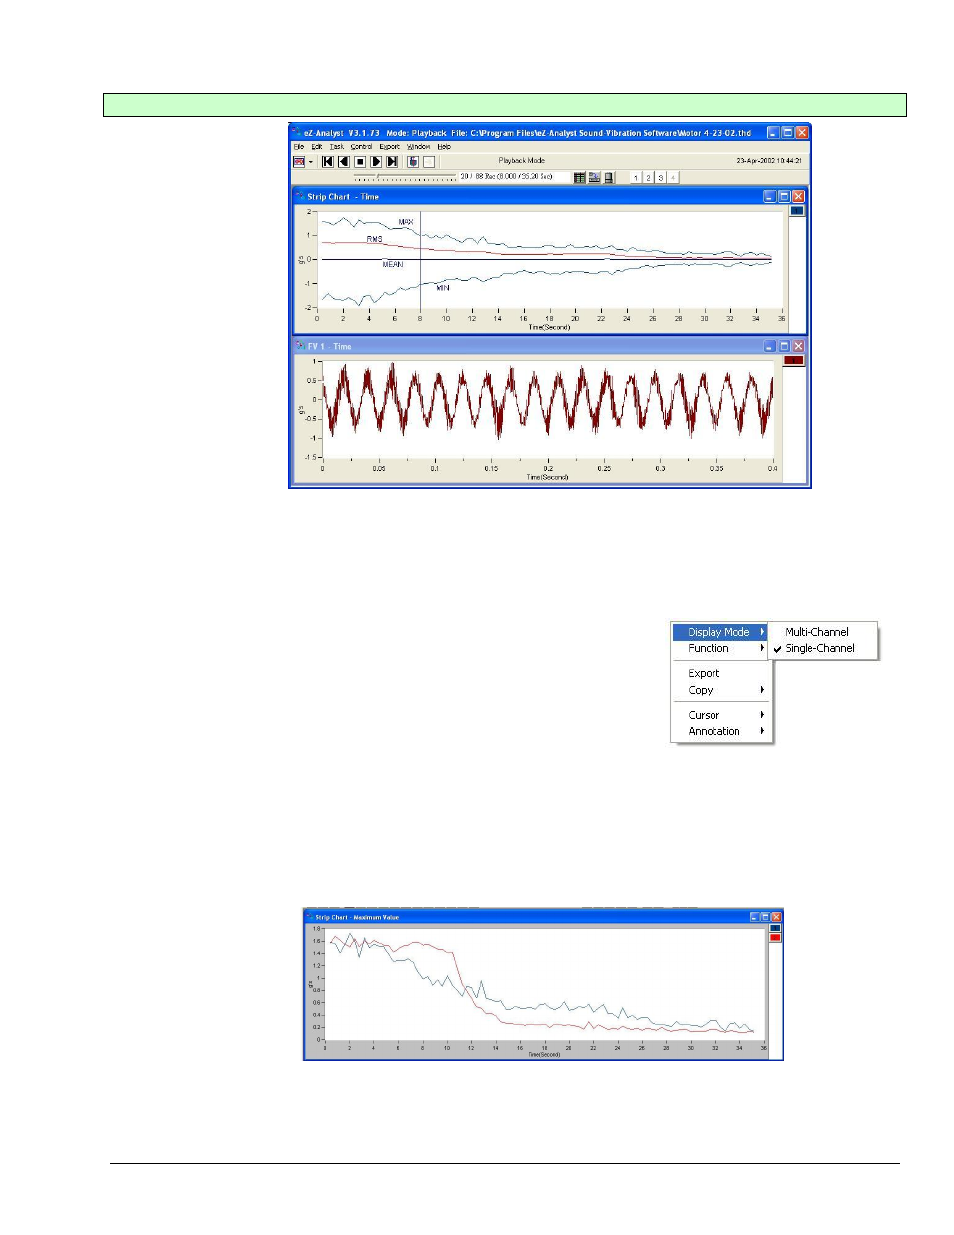
Strip Charts [No associated toolbar button]
Upper Plot Display - Strip Chart with 4 Traces for 1 Channel
Lower Plot Display - Time Function View
To add a strip chart, open the Window pull-down menu and select “Add Strip Chart.”
A strip chart has two display modes. These are
Single-Channel and Multi-Channel.
To select the strip chart’s mode:
1. Right-click within the strip chart.
2. Position the mouse-cursor over the text “Display
Mode.”
3. Select Single Channel of Multi-Channel, as desired.
Single Channel – When this mode is selected the strip chart will show 4 traces for a single
channel. The traces are for maximum values, minimum values, the mean, and RMS. The top
plot display in the preceding figure illustrates the single channel mode.
Multi-Channel – When this mode is selected the strip chart will show one or more channels,
as determined by the user. When in multi-channel mode, only traces of the maximum values
for each channel will be displayed. An example of a strip chart with two channels follows.
Strip Chart, Multi-Channel Mode