Measurement Computing eZ-Analyst rev.14.1 User Manual
Page 120

7-6 Waterfalls, Order Tracking, and Slice Views
878193
eZ-Analyst
In addition to the Waterfall configuration dialog, several Waterfall and Frequency Slice plot options can be
accessed via keystrokes. This is done as follows:
1. Click on the Waterfall plot or Frequency Slice plot to make it the active control.
2. Click on the designated key to obtain the desired result, as follows:
[
A
] – to toggle in or out of Autoscale mode.
[
L
] – to toggle in or out of the Log display mode.
[
G
] – to turn grids “on” or “off” in a Frequency Slice plot. When the grids are
turned off the left and right arrow keys will reposition the cursor.
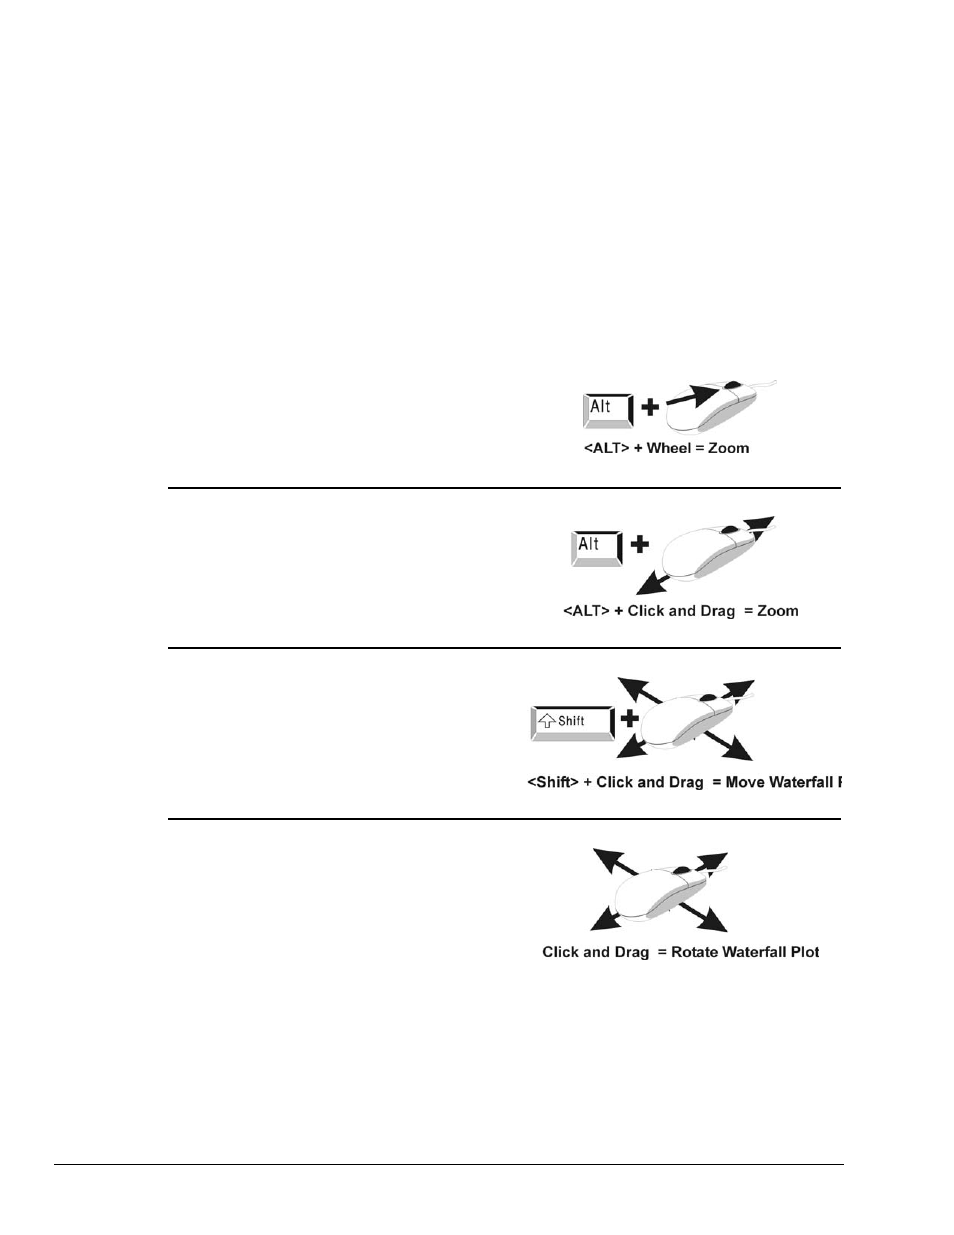
There are four ways in which you can use your PC mouse to alter your view of the 3D Waterfall Plot.
These include two methods of zooming in or out, one method of repositioning the plot, and one method of
rotating the plot. The following illustrate each function.
There are 2 methods of zooming in or out:
1
st
Zoom Method: Hold down the
rotate the mouse wheel forward to zoom out, or
rotate the wheel towards you to zoom in.
2
nd
Zoom Method: Hold down the
drag the mouse up to zoom out, or down to zoom in.
To reposition the plot:
Hold down the
This moves the plot to a new position.
To rotate the waterfall plot:
Drag the mouse to achieve the desired
angle of view.
