Measurement Computing eZ-Analyst rev.14.1 User Manual
Page 38

4-2 Edit Menu
978791
eZ-Analyst
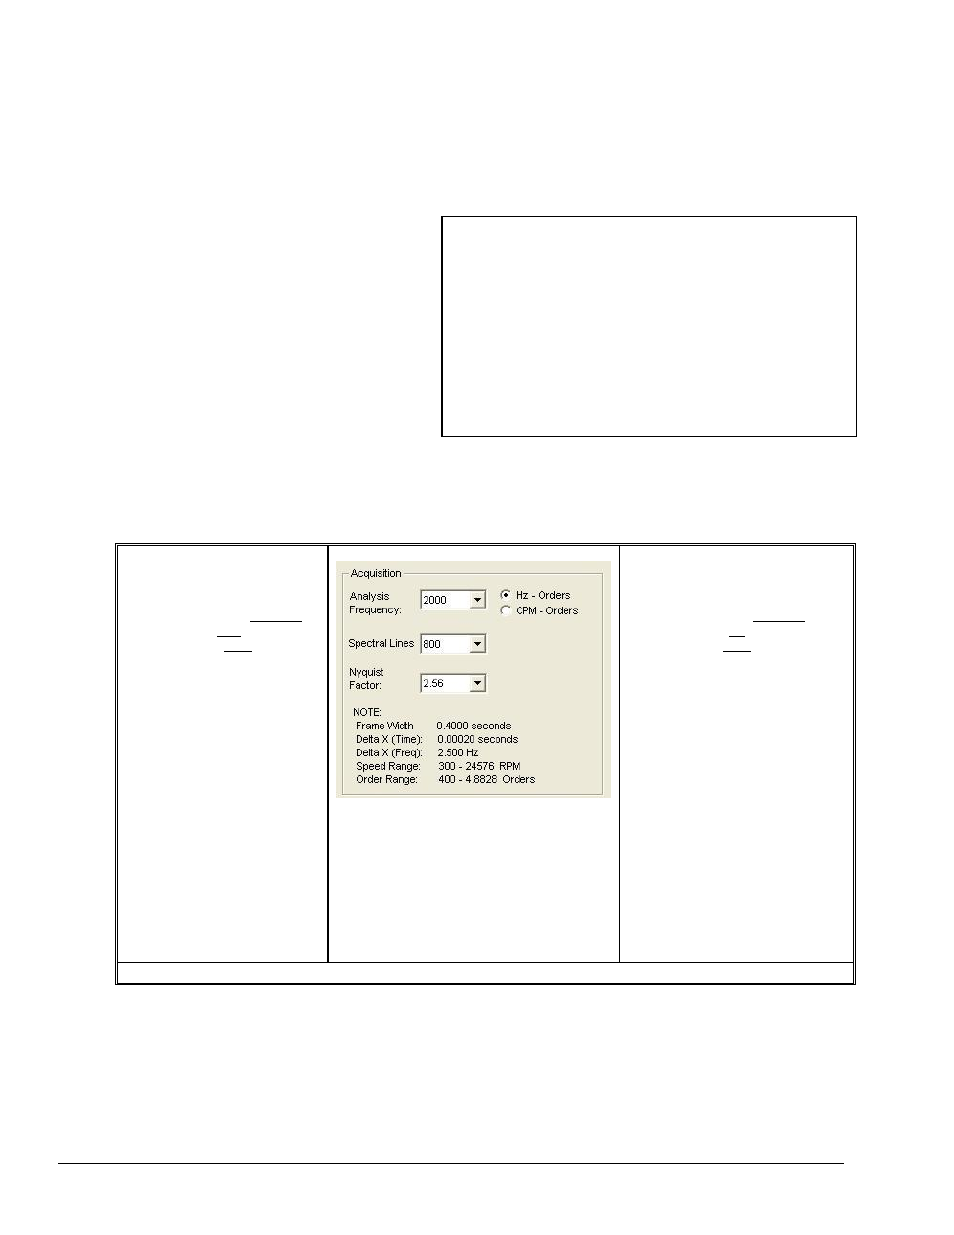
A Note Regarding Frequency Resolution
This note pertains to frequency resolution and is related to the values seen in the Analyzer Tab’s
Acquisiton Panel (next two figures). The frequency resolution is related to the Analysis Frequency
(bandwidth), the number of spectral lines, and the Nyquist factor (a user-selected variable).
It is also related to the number of data points in one block of data (the blocksize). The program
automatically adjusts the blocksize to maintain the selected spectral lines.
The following equations apply.
b = S (n)
and
S = b / n
w = b / (n x f)
and
w = S / f
Where:
S = Spectral Lines
w = Frame Width (in seconds)
b = Blocksize
n = one of 3 selectable
Nyquist Factors. These are:
2.56, 5.12 and 10.24
f = Analysis Frequency
“Delta X” Frequency = 1 / w
Where:
“Delta X” Frequency is the frequency resolution
w = Frame Width
With these equations we can see how the Frame Width and Delta X (Frequency) are calculated.
Example 1 (see figure)
Given:
Analysis Frequency 2000 Hz
Spectral Lines 800
Nyquist Factor 2.56
w = S / f
= 800 / 2000
= 0.4 seconds
Also, since blocksize equals
Spectral Lines times Nyquist
factor ( S x n) we would have
a blocksize of 2048, i.e.,
800 x 2.56. Thus:
w = b / 2.56 x freq.
= 2048 / (2.56)(2000)
= 0.4 seconds
Delta X (Freq) = 1/w
= 1 / 0.4
= 2.5 Hz
Acquisition Panel on
the Analyzer Tab
The values shown pertain to example 1.
Speed Range and Order Range are the
theoretical limits for RPM and Orders
based on the current settings for
Analysis Frequency, Spectral Lines,
and the Nyquist Factor.
Example 2 (no figure)
Given:
Analysis Frequency 5000 Hz
Spectral Lines 50
Nyquist Factor 2.56
w = S / f
= 50 / 5000
= 0.01 seconds
Delta X (Freq) = 1/w
= 1 / 0.01
= 100 Hz
Note: A “Delta X” Freq. of 2.5 Hz indicates a higher frequency resolution than a “Delta X” Freq. of 100 Hz.
Higher frequency resolutions indicate that the signal trace will be based on more data
points for a given time frame. The higher the frequency resolution, the smoother the trace
will be.
With other factors unchanged . . .
Increasing Spectral Lines increases Frequency
Resolution.
Increasing Analysis Frequency decreases Frequency
Resolution.
Increasing the Nyquist Factor results in a higher
blocksize (more data points). The number of spectral
lines remains constant, unless changed by the user.
The lower the “Delta X” frequency, the higher the
Frequency Resolution. Thus, a “Delta X” Frequency of
6.25 Hz indicates a higher frequency resolution than does
a “Delta X” Frequency of 100 Hz.
