Measurement Computing eZ-Analyst rev.14.1 User Manual
Page 130
A-4 Keyboard Controls
878193
Appendix A
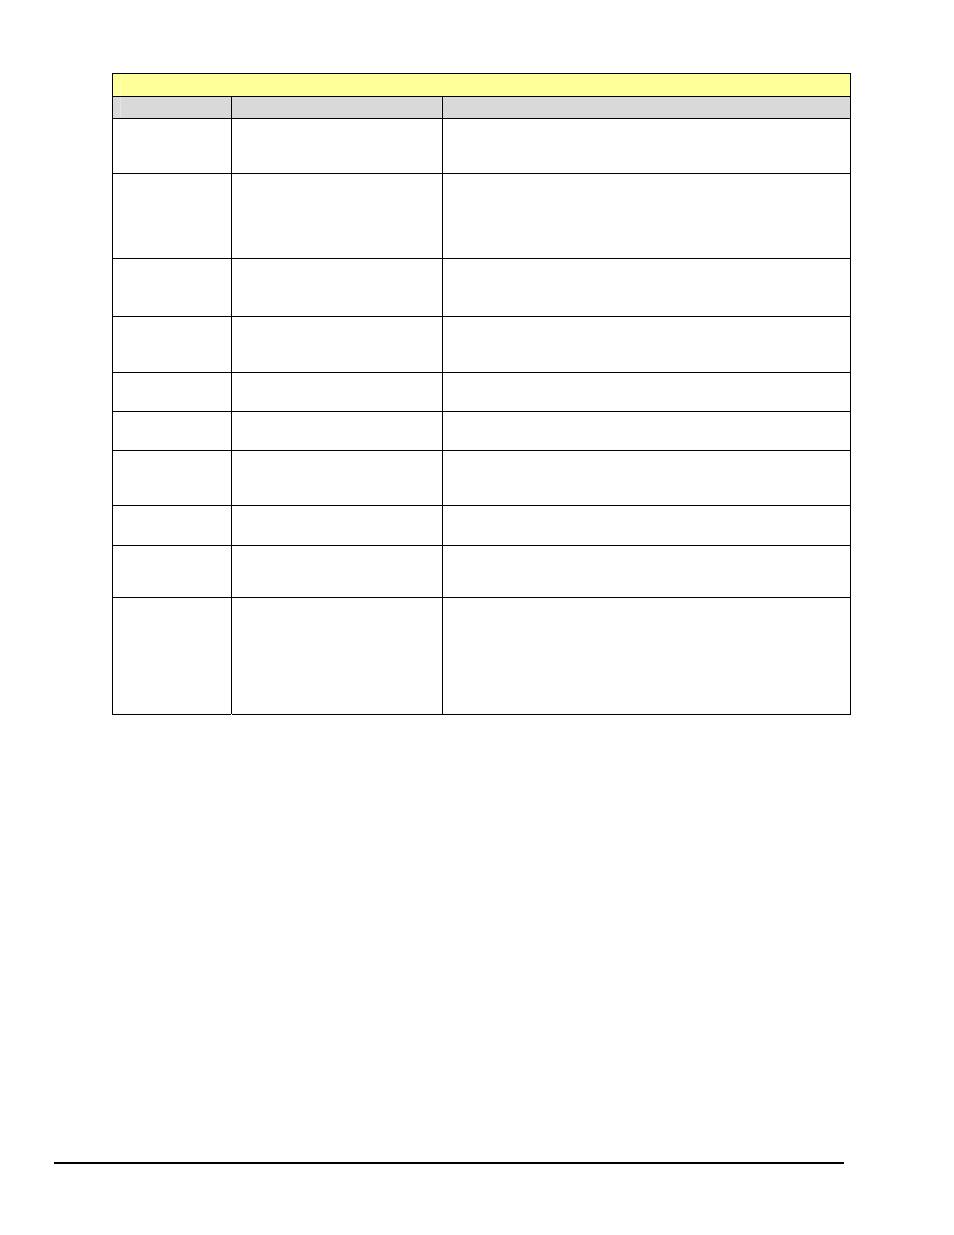
Slice View Control
Note that the use of keys in this table assumes that the Slice View has focus.
Keys
Function
Comments
Resets the Playback record
pointer to the first record.
-----
A
Autoscale / Manual Scale
Toggles between Autoscale and Manual scale. Manual
scale values are the ones you enter into the Value Input
boxes near the ends of the X & Y axes. The Value Input
boxes [for minimum or maximum values] open when you
click to the left or below the plot window.
L
Linear Scale / Log Scale
Toggles between Linear (Lin) and Log scaling.
R
Reset
Resets the plot display window and the playback record
pointer to the first record.
,
(comma)
Move Left, 1 Record
Moves the record pointer one record to the left.
.
(period)
Move Right, 1 Record
Moves the record pointer one record to the right.
+
Zoom-in
Zooms in to the display in the area around the record
pointer.
-
Zoom-out
Zooms out from the display.
Manual Zoom
Hold down the
in the plot window to zoom in on the area covered by the
drag operation.
Mouse
Click
Y and X axes, Scale
minimum and maximum
To change the x or y scale values of the Slice View
display: Click the mouse with the cursor positioned in the
x or y axis border region. You must click near the
maximum or minimum value of the associated axis scale.
A value box will open. Key in the newly desired minimum
or maximum value for x or y. Repeat for other axes
values as desired.