Add strip chart …… 3-13, Add strip chart, Delete window – Measurement Computing eZ-Analyst rev.14.1 User Manual
Page 32: Input channels
3-14 Menus
878193
eZ-Analyst
Window Menu
>
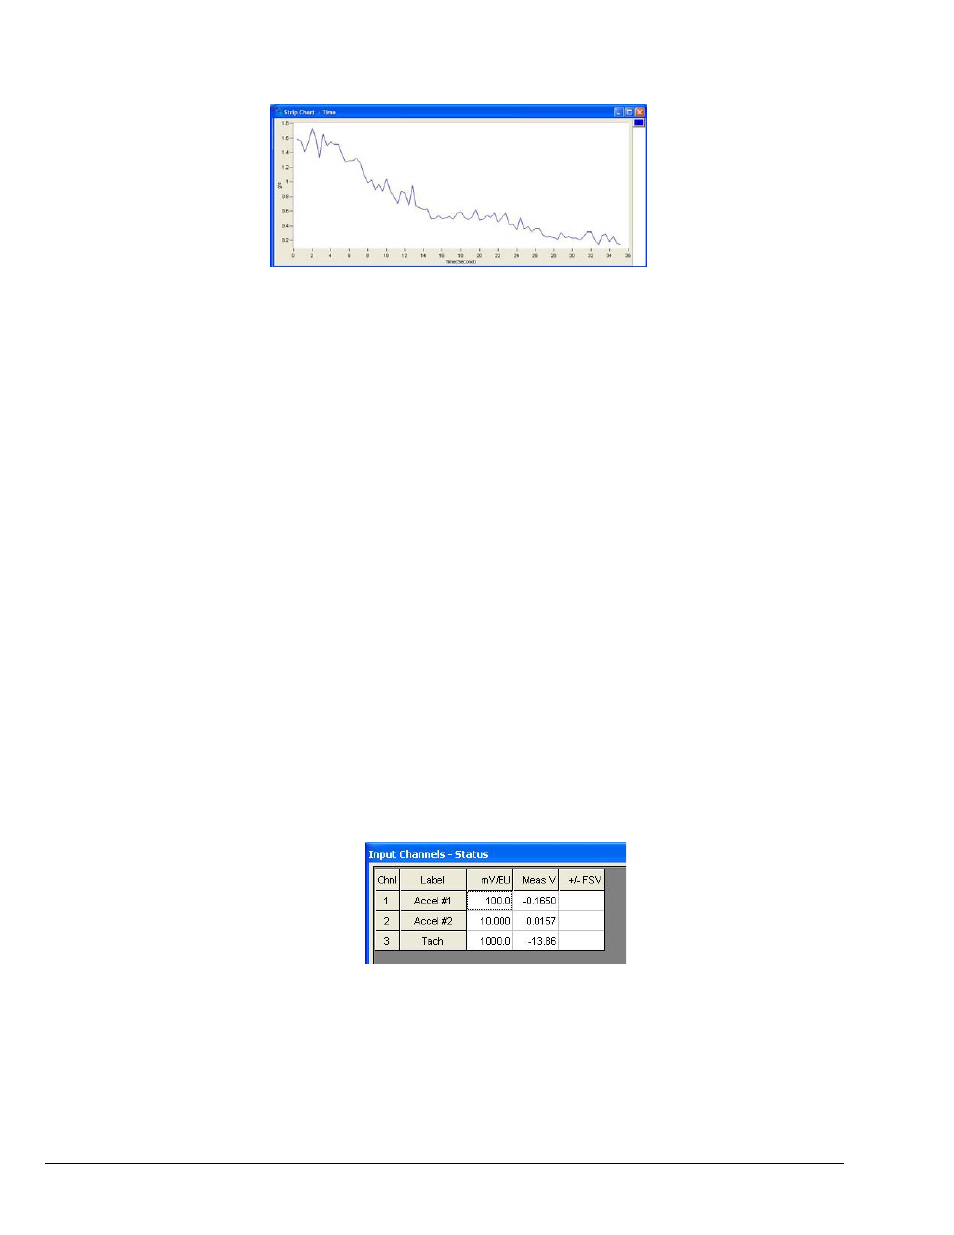
Add Strip Chart
This menu selection opens a strip chart plot window.
Example of an Added Strip Chart
Window Menu
>
Delete Window
Deletes the window that is currently in focus. When multiple plot windows are open, one is
always the “focus window. When a window does not have focus, its title bar is dimmed. To
change the “focus window,” simply click on top or side border of the window of interest.
Window Menu
>
Input Channels
The Input Channels window is selected from the Windows pull-down menu.
Buttons
When selected, “Buttons” removes the channel button boxes from the toolbar and displays
them in a floating window. The buttons are used in the exact same manner as when they were
located on eZ-Analyst’s main window. Removing the checkmark from “Buttons” places the
channel buttons back onto the toolbar. Note that the button [located
on the toolbar, just to the left of where the channel buttons reside] provides the same
functionality. See chapter 5 for location.
•
To add a channel: use the mouse to click and drag a channel box from the
complete channel button display into the plot area.
•
To remove a channel: use the mouse to click and drag a channel box (from the
right-side of the plot) into the plot area.
Status
The Status dialog box (following figure) uses a chart to indicate the followings:
•
Volts linear
•
percent of the Full-Scale Voltage (FSV)
The status box includes “maximum” bars to show the highest level of signal value reached by
each channel during the measurement process.
Status
Meas V
Measured Voltage
+/- FSV The Full-Scale Voltage
Delta % The percentage difference between the measured voltage
and the Full-Scale voltage, such that Meas V is n% of FSV;
with n being the value of Delta %.