Measurement Computing eZ-Analyst rev.14.1 User Manual
Page 15
eZ-Analyst Series
878193
Introduction 2-3
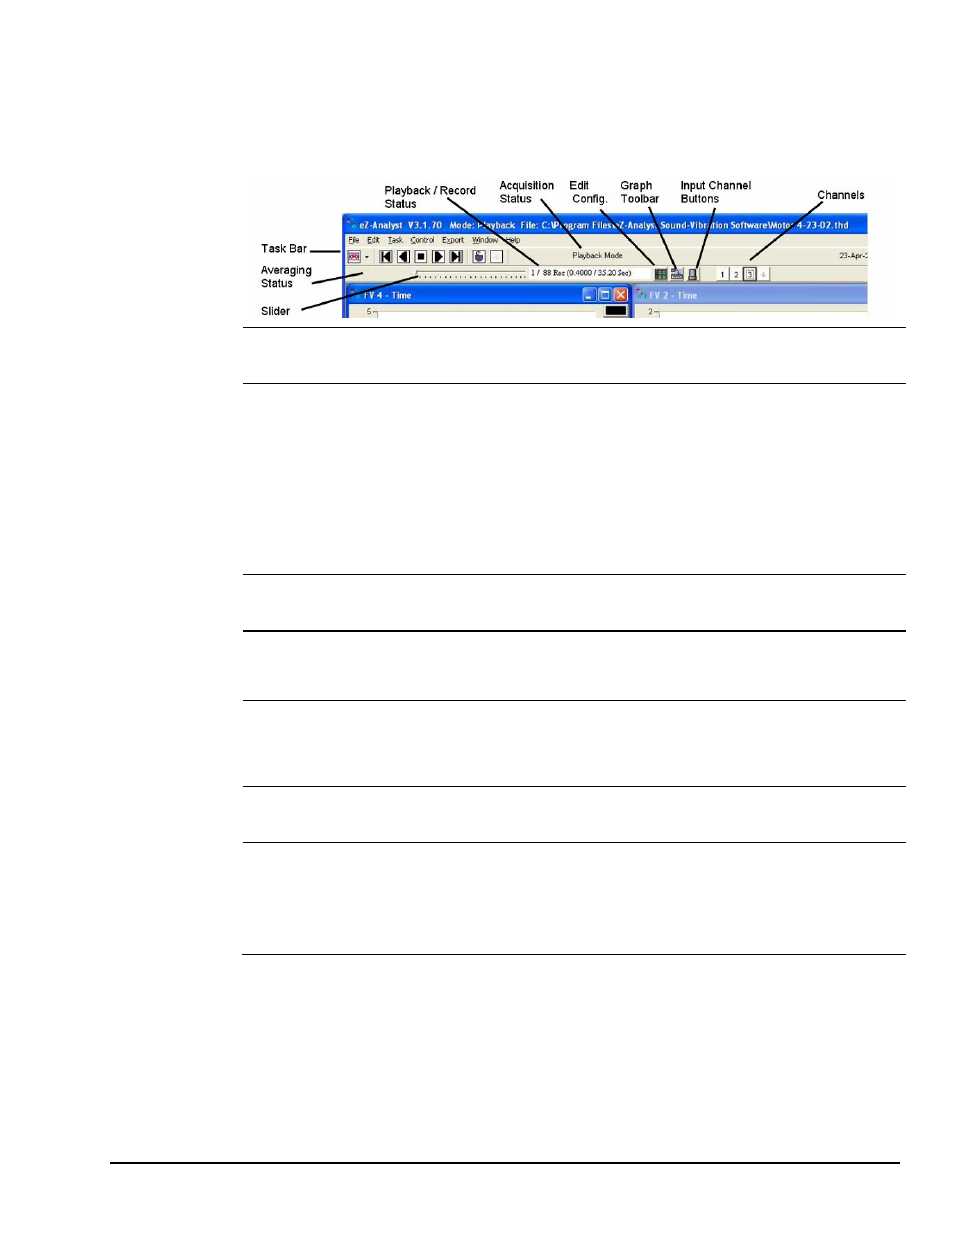
You can select the Measurement Mode or the Playback mode from either the Task pull-down
menu, or by using the
Task Tool Bar automatically changes to accommodate the selected mode.
1
Status
Message
A message regarding the status, if applicable, will be displayed in this area. Examples of
possible messages are: Double Hammer Rejected, Overload Rejected, Reject (Manual Reject
Mode), and GAP.
2
Acquisition
Status
Indicates the status of the acquisition.
Waiting Trigger indicates that a trigger has not been recognized since the Acquire button
was clicked.
Triggered indicates eZ-Analyst is capturing and processing data based on the setup
conditions.
Acquiring indicates that data is being acquired, but is not being recorded to disk.
Recording indicates that data is being recorded-to-disk, as it is being acquired.
Completed indicates eZ-Analyst has finished processing the frame of data.
The “Averages Count” increments by 1 at this time.
3
Date/Time
Provides time in the following format: Day-Month-Year, Hour: Minutes: Seconds.
When in Record Mode the current time is displayed.
When in Playback Mode the measured time is displayed.
4
Slider Bar
The sliding bar indicates the relative location of the displayed data. The record number and
the number of records in the file are listed to the right. The slider can be used to quickly
locate a specific record. Note that both the Record and the Playback mode make use of the
slider bar.
5
Playback /
Recording
Status
Displays the current record and the total number of records to be collected. Time
equivalents are included in parenthesis
Example, 12/25 means that the record currently displayed is the 12
th
record, out of a total of
25 records.
Averaging
Status
This field shows when the Averaging Mode is used, during the Scope Mode or the Playback
Mode. A display of 2/5 would indicate that 2 averages have been performed out of a total of
5 averages to be performed.
6
Channels
Each numbered box represents a channel. Drag a channel [channel-box] to the plot area to
have its data displayed. That channel’s data is plotted in a distinct color and a color-coded
channel button is displayed to the right of the plot.
Reference channels are bold and italic. The underlined channel is the current reference
channel. Use the right mouse button to select current reference channel. Reference
channels are specified in the Configuration accessed via the Edit Menu.