Measurement Computing eZ-Analyst rev.14.1 User Manual
Page 114
6-12 Interactive Plot Display
988191
eZ-Analyst
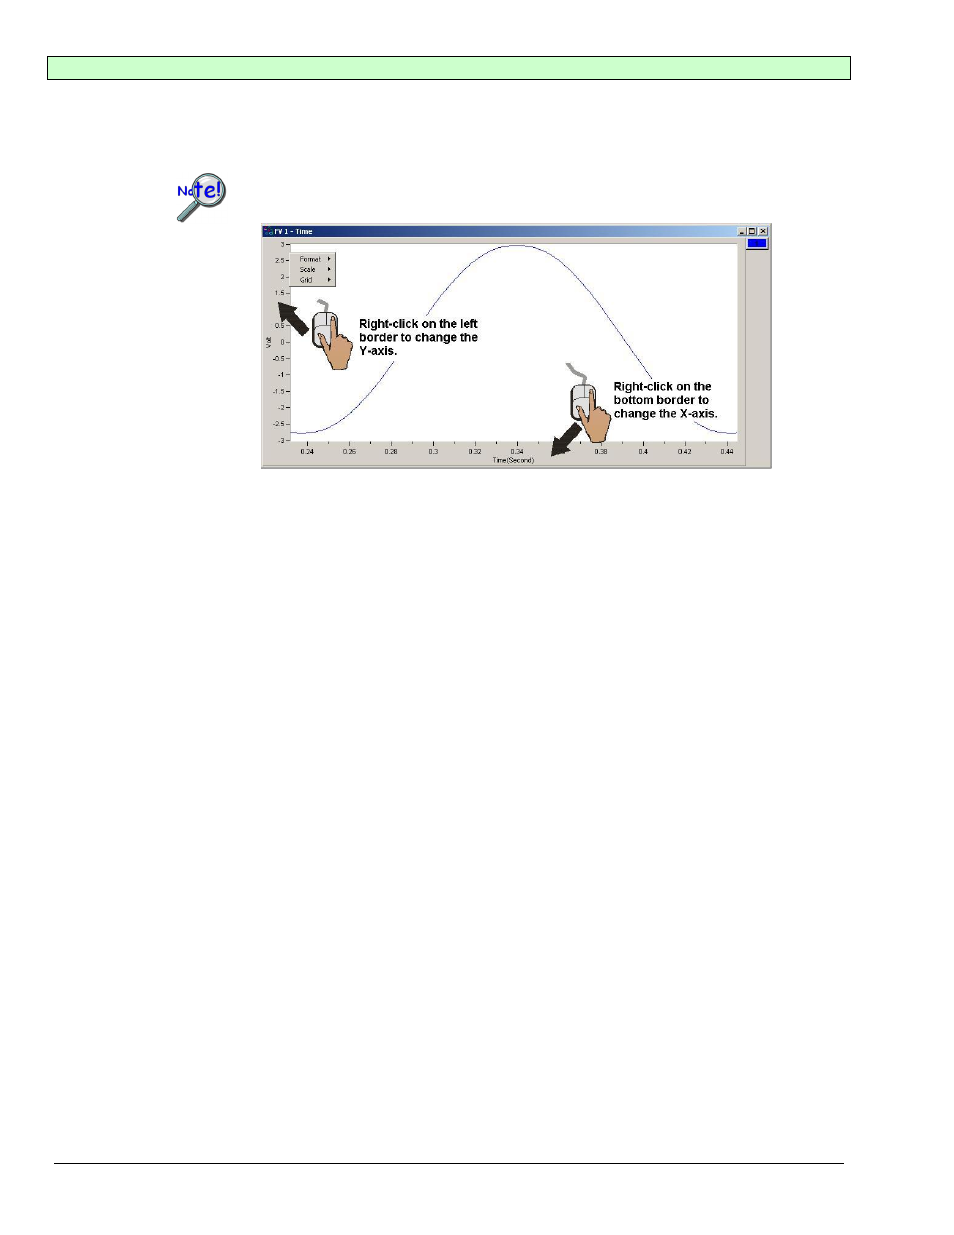
Changing the Plot’s Format / Scale / Grid
Right-Click on the plot’s border to open a popup menu (see figure). If you want to change the
y-axis, right-click on the plots left border. If you want to change the x-axis, right-click on the
plot’s bottom border.
Changing the plot Format, Scale, or Grid affects the display only.
It does not change the real data.
Format
The Format menu allows you to change the axis format of the plotted data. Choices are
Linear, Log, and dB (valid on for the y-axis).
Scale
The Scale menu allows you to change the plot scale to AutoScale, FixedScale, or Manual.
AutoScale ensures that all the captured data is visible on the plot.
Grid
The Grid menu allows you to place and remove grid lines from the graph of plotted data. You
can also turn the grid on and off by pressing the “G” hot key.