Measurement Computing eZ-Analyst rev.14.1 User Manual
Page 14
2-2 Introduction
878193
eZ-Analyst Series
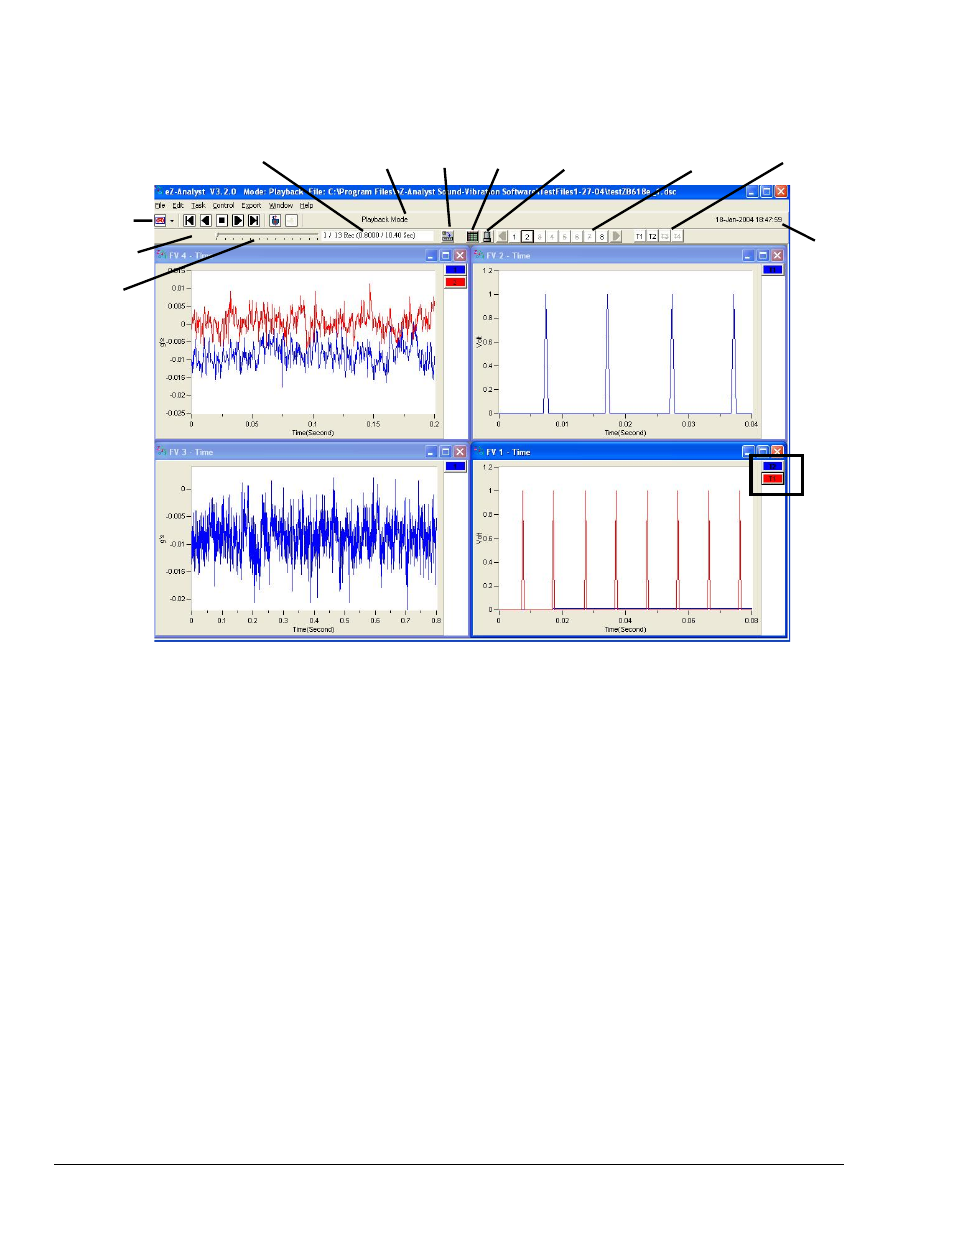
Four Function View Windows in Playback Mode
eZ-Analyst is a graphical analysis application that can be used to collect, analyze, record, and
play back recorded data. With use of a 600 Series, ZonicBook/618E, or WaveBook analyzer,
ez-Analyst can collect and display multiple channels of data in real-time. The graphical
displays can consist not only of the raw time-domain data, but also plots of frequency domain
data. For example, real time FFT (Fast Fourier Transform) plots.
Data that is recorded to disk-file is in the raw time domain and can be played back for
additional analysis time and time again. For example, a raw signal can be played back over-
and-over using different FFT Window algorithms to manipulate the signal. Once the desired
results have been achieved, the new data can be exported to a different file and format, while
preserving the original file. In addition, the playback capability does not require the presence
of analyzer hardware.
Slider
Task Bar
Acquisition Graph Edit Input Channel
Status Toolbar Config. Window (Open/Close)
Analog Input Tach
Channels Channels
Date/Time
Playback / Record
Status
Channel
Identifiers
Averaging
Status