Display preferences, Edit menu > display preferences – Measurement Computing eZ-Analyst rev.14.1 User Manual
Page 91
eZ-Analyst
978791
Edit Menu 4-55
Edit Menu >
Display Preferences
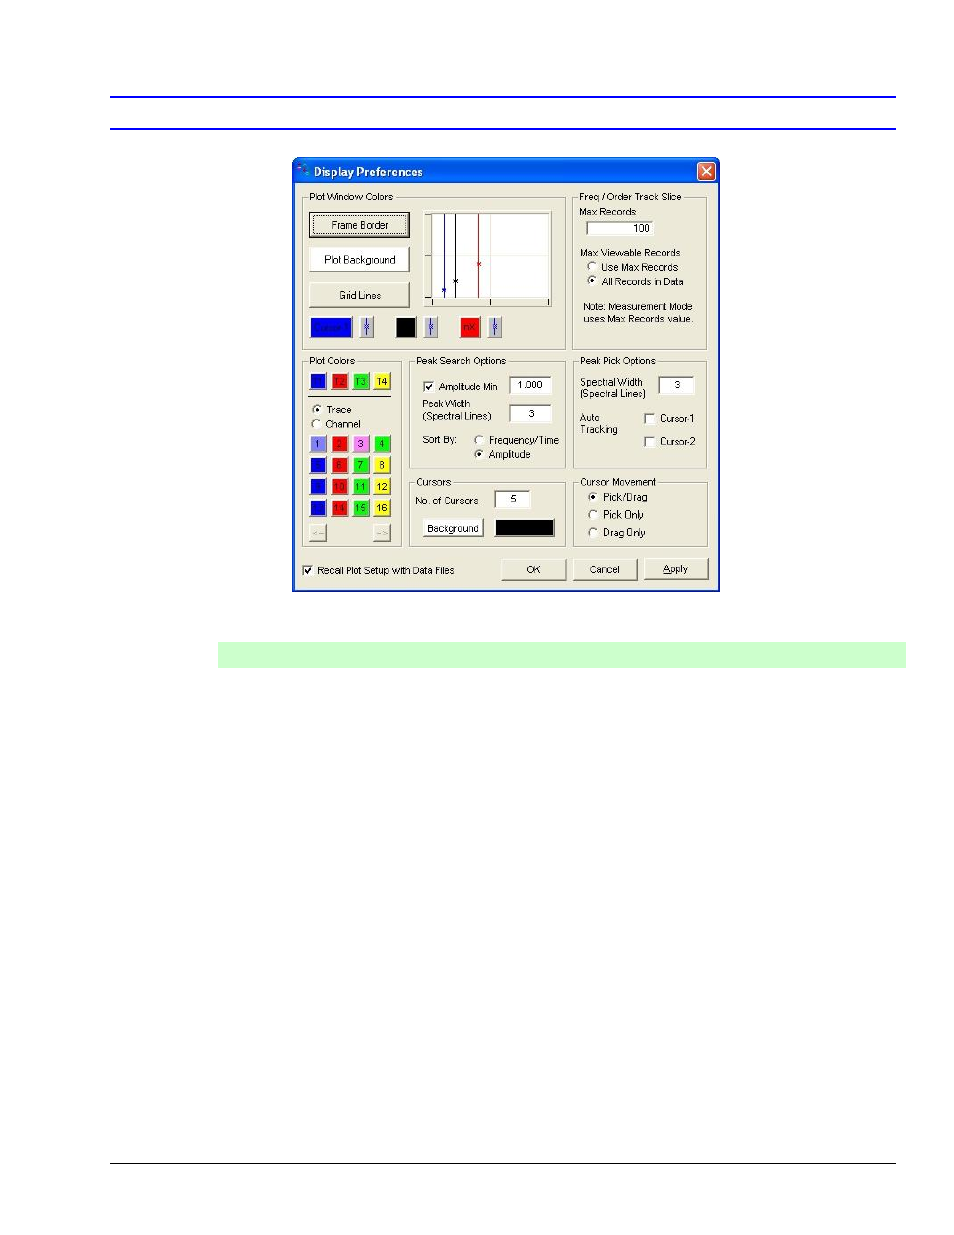
Display Preferences
Panel
Function
Plot Window
Colors:
Used to edit the colors of Frame Border, Plot Background, Grid Lines, and Cursors. In
addition, the toggle buttons with the “line/asterisk” images are used to obtain a line
cursor or a point cursor.
To change a Plot Window display color:
1. Click on the button that applies to the display characteristic, for example,
2. Select a color by clicking on a color square, or by defining a Custom Color.
3. Click
4. Repeat the steps 1 through 3 for each Plot Window color that you want to change.
5. When finished, click
Freq / Order
Track Slice:
Applies to Frequency Track Slices and Order Track Slices. The measurement mode will
always use the maximum number of records; but for playback modes this panel
determines whether:
a) all the data records will be displayed, or
b) the maximum stored records will be displayed.
The user can click in the numeric field to change the number of records to be stored.
Plot Colors:
The top four buttons in this panel are used to set colors for tachometer channels. The
16 additional buttons are used to set colors for traces or channels. If you want a
channel to remain a certain color ensure the channel radio button selected. Click on a
channel’s color chip to open a color palette. Click on the desired color, then click