Measurement Computing eZ-Analyst rev.14.1 User Manual
Page 118
7-4 Waterfalls, Order Tracking, and Slice Views
878193
eZ-Analyst
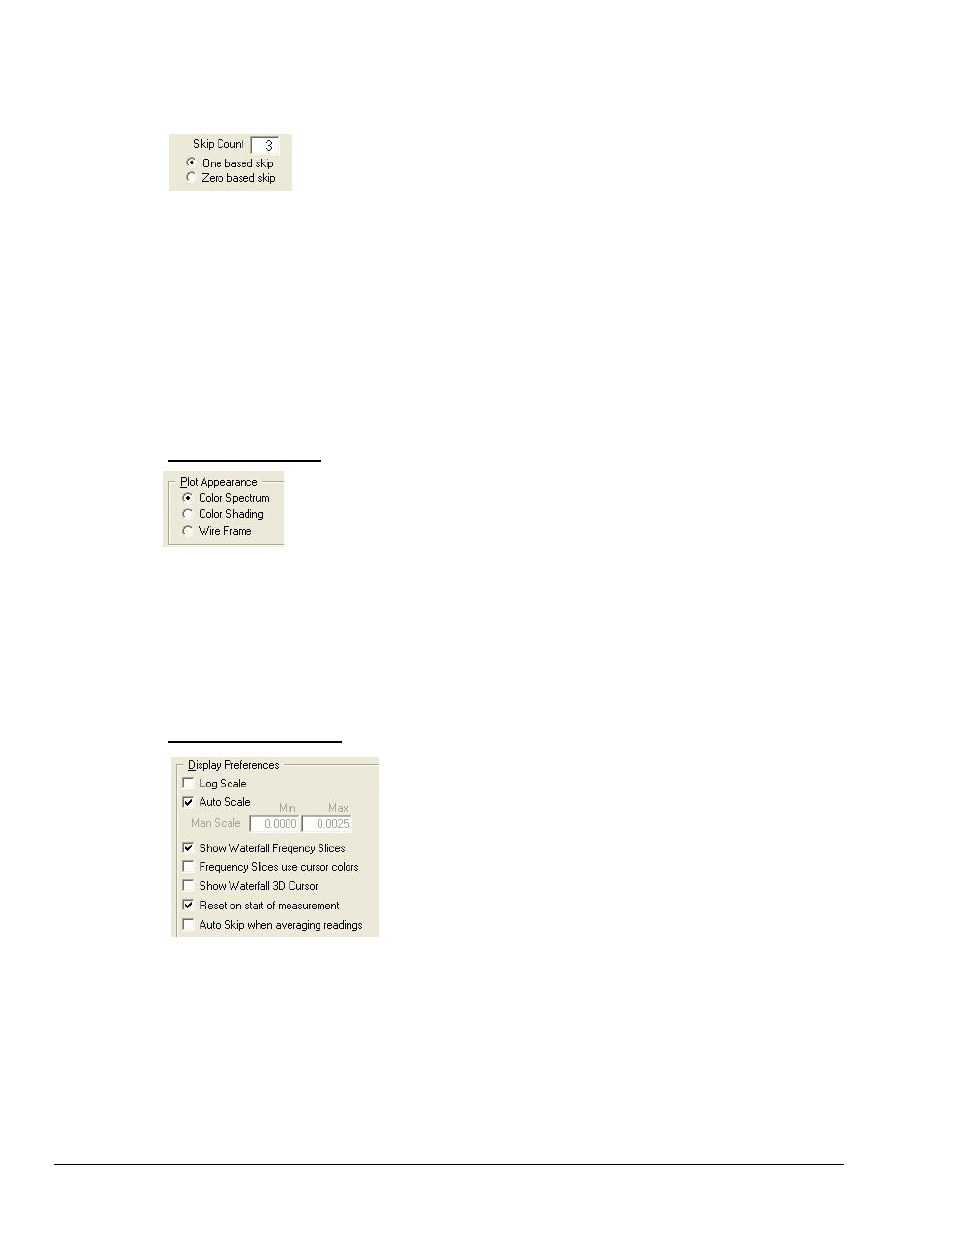
The Skip Count setting allows you to decimate the data that would be displayed in the waterfall plot. A
Skip Count setting of 3 only displays every third record. A Skip Count value of 1 displays every record.
In addition to the Skip Count, you must select [by radio button] to have a count that
is either “One based skip” or “Zero based skip.” Selecting “One based skip”
results in plotting the first record followed by a skip of the number of records
indicated in the Skip Count numeric field. For example, a One based skip count of
“3” will plot the 1
st
, 4
th
, 7
th
, 10
th
…etc records. A Zero based skip count plots records that are multiples of
the Skip Count. For example, a Zero based skip of “3” will plot the 3
rd
, 6
th
, 9
th
, 12
th
…etc records.
There are two parameters that control the appearance of the Frequency Slice traces that are drawn in the
3D Waterfall plot. These are: Line Width and Transparency %. Line Width is the thickness of the traces
in pixels. Transparency % controls the opaqueness of the lines. A value of “0” means no transparency.
The Size & Position panel includes two buttons. The
to the default value. The
panel numeric fields.
All settings in the Size & Position panel operate immediately on the waterfall plot, with the exception of
Display Records, Skip Count & Skip Count Base selection settings.
Plot Appearance Panel
The Plot Appearance group provides three options that allow you to choose how you
would like the 3D Waterfall surface plot to be drawn. You have your choice of
viewing the plot as a Color Spectrum, Color Shading, or Wire Frame.
The Color Spectrum selection draws the plot as a rainbow of colors from violet at the lowest value to red
at the highest.
Color Shading draws the plot as a color gradient from darkest at the lowest value to
lightest at the highest. The color used for the gradient is the color of the channel in the
Spectrum plot.
Wire Frame plotting renders the plot as a grid of black lines.
Display Preferences Panel
This group of settings allows you to control various aspects of how the
3D Waterfall plots behave.
The Log Scale check box switches the Waterfall plot Logarithmic
display mode on and off.
The Auto Scale check box switches the Waterfall plot in or out of the
automatic scaling mode. When the check box is unchecked, you can
enter the upper and lower manual scale limit values that will be applied
when Auto scaling is not in effect.
Show Waterfall Frequency Slices will show or hide the Spectral line
plots in the Waterfall plots. The Frequency Slices are defined by the spectral lines associated with the
cursors that are positioned in the Spectrum plot window. Turning off the Frequency Slice plots can
improve performance when rendering the Waterfall.
Frequency Slices use cursor colors will change the colors of the Frequency Slice plots in the Waterfall.
When left unchecked, the slice plots use the channel colors as defined in the eZ-Analyst preferences dialog.
When checked, the slice plots will assume the colors of the cursors as they appear in the Spectrum plot
window.