Eagle quantum premier config – Det-Tronics S3 Graphics User Manual
Page 95
11-14
EAGLE QUANTUM PREMIER CONFIG.
Version 6.0
EAGLE QUANTUM PREMIER CONFIG.
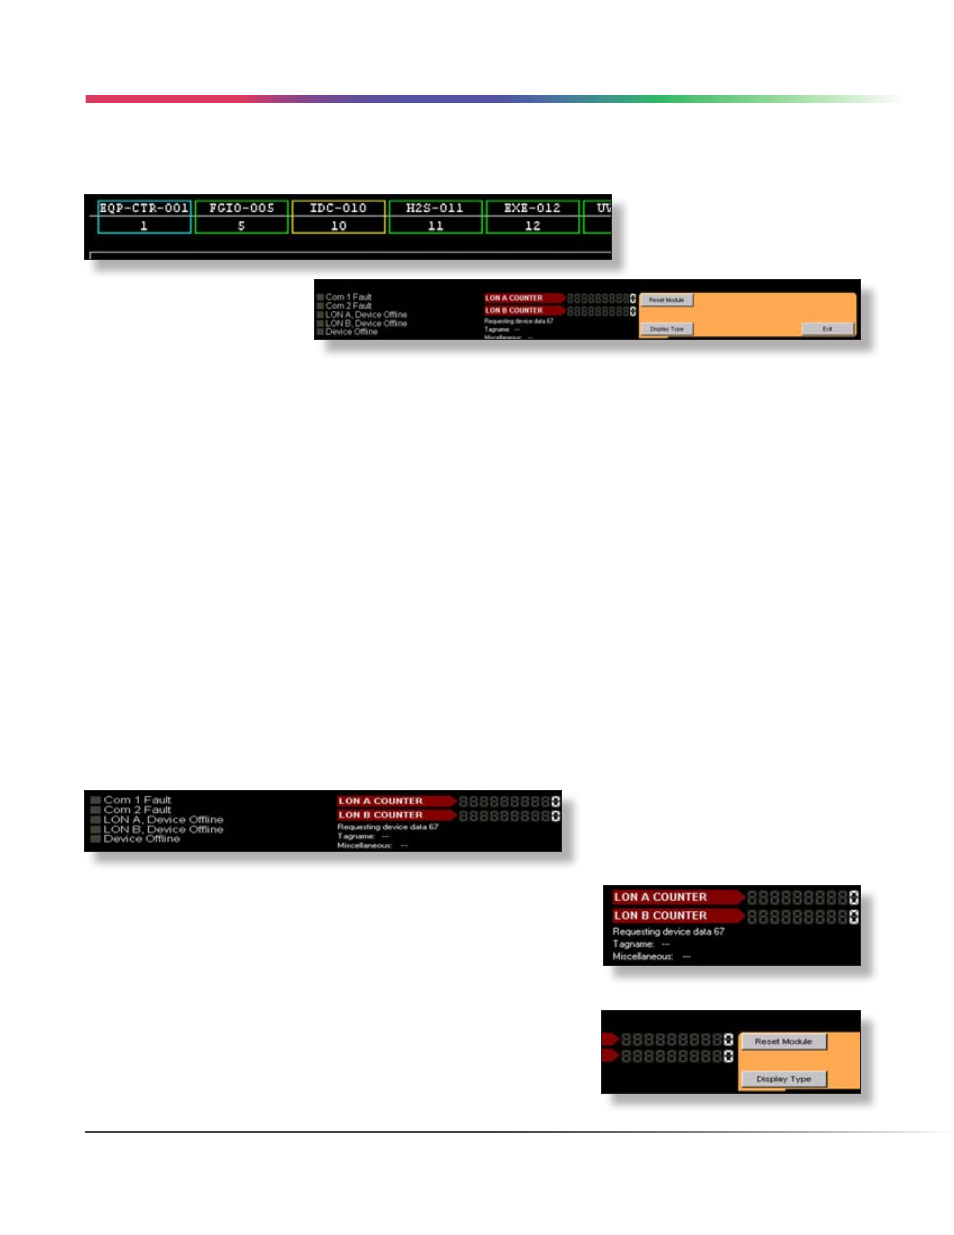
Diagnostic data is displayed to two ways on the display, through the color of the rectangle defining each node,
and through indicators and counters at the bottom of the screen.
The LON is typically wired as a loop
starting and ending at the controller
which has two physical interfaces
(transceivers) labeled “A” and “B”.
On an intact LON each of
these transceivers receives
information from all of the field
devices at roughly the same
time. A nodes proximity to one or the other transceiver along with the propagation delay of long wiring distances
and/or network extenders will induce a small time differential. This differential will cause an individual nodes
message to be read by either the A or B transceiver first and processed by the controller.
If the last message processed by the controller for a node comes through the “A” transceiver the rectangle
representing that node will have a green outline on the diagnostic LON schematic. If it comes through the “B”
transceiver its rectangle will be outlined in yellow.
Normal LON
On a healthy LON with good network integrity, message traffic will appear random and each nodes outline color
will constantly change without any pattern.
Faulted LON
On a faulty LON with a break in the wiring or other abnormal condition, message traffic may have only one path
to the controller. This would be indicated graphically by all of the nodes before the problem changing to one
color (green or yellow) and the nodes after the problem changing to the other color. The area where the color
transition occurs is most likely the problem area.
In this way the LON diagnostic display can be used to localize LON wiring problems. In addition to the graphic
representation of message traffic on the display, quantitative data is available for diagnostics through indicators and
counters.
If a node on the schematic is selected (by
single-clicking on its rectangle) the five
indicators in the lower left of the screen
will show the diagnostic data from the
selected node.
To the right of these indicators are LON counters that show message
processing by the controller. On a healthy system the counters should
be close to equal. On a system with a degraded network, there may be
a significant offset showing either the “A” or “B” transceiver getting the
majority of traffic.
Reset Module
To the right of the LON counters is the “Reset Module” button. This
command forces a selected field device to perform a “soft restart”
effectively “rebooting” the field device. This will also reset any latched
alarms, faults, outputs, etc.
COMMAND BAR • LON DIAGNOSTIC