Point display, Eagle quantum premier devices – Det-Tronics S3 Graphics User Manual
Page 179
12-64
EAGLE QUANTUM PREMIER DEVICES
Version 6.0
EAGLE QUANTUM PREMIER DEVICES
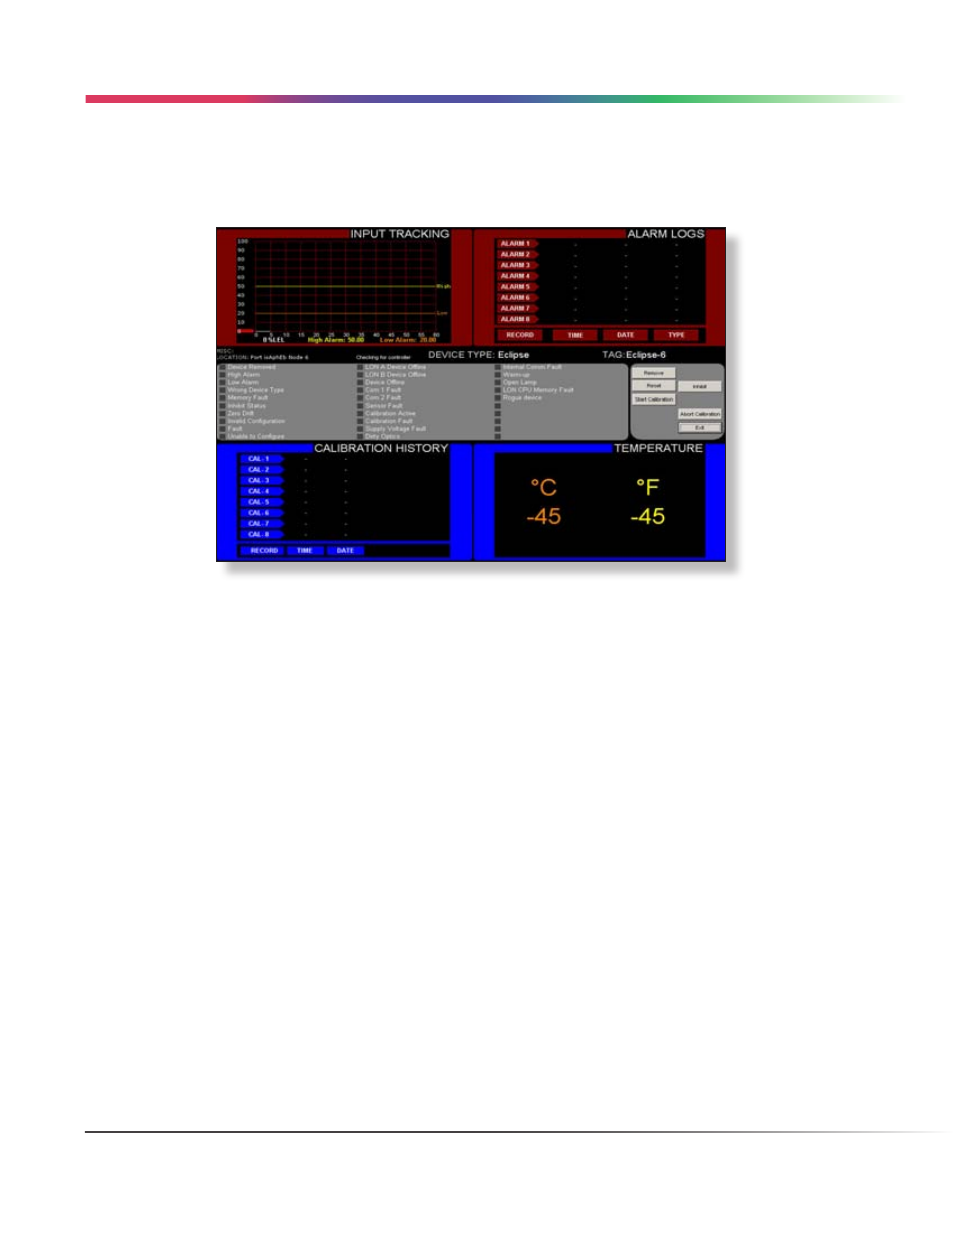
Point Display
The Eclipse has a custom “Point Display” that can be accessed from either the Point Display button on the
Command Bar or from the Online Mode.
The point display provides a single window view of all available real-time data for the device.
Input Tracking
The upper left quadrant contains a 60 second analog track running from left to right, the newest data on the left
margin. This area graphically displays the low and high alarm setpoints as horizontal lines crossing the graph
area, yellow for high and orange for low. Digital readouts at the lower margin also display the PV and alarm
setpoints.
Alarm History
The upper right quadrant displays the alarm history for the device. The last eight alarms with date and time are
shown. This data is stored in the field device and retrieved over the LON for display.
Calibration History
The lower left quadrant displays the calibration history for the device. The last eight calibrations with date and
time are shown. This data is stored in the field device and retrieved over the LON for display.
Temperature
The lower right quadrant displays the sensor package temperature.
Status & Diagnostics
Crossing the whole point display in the center is an area displaying 24 discrete pieces of status and diagnostic
information on the detector.
PIRECL • POINT DISPLAY