RADWAG MYA 5.3Y.F1 Microbalance User Manual
Page 93
- 93 -
−
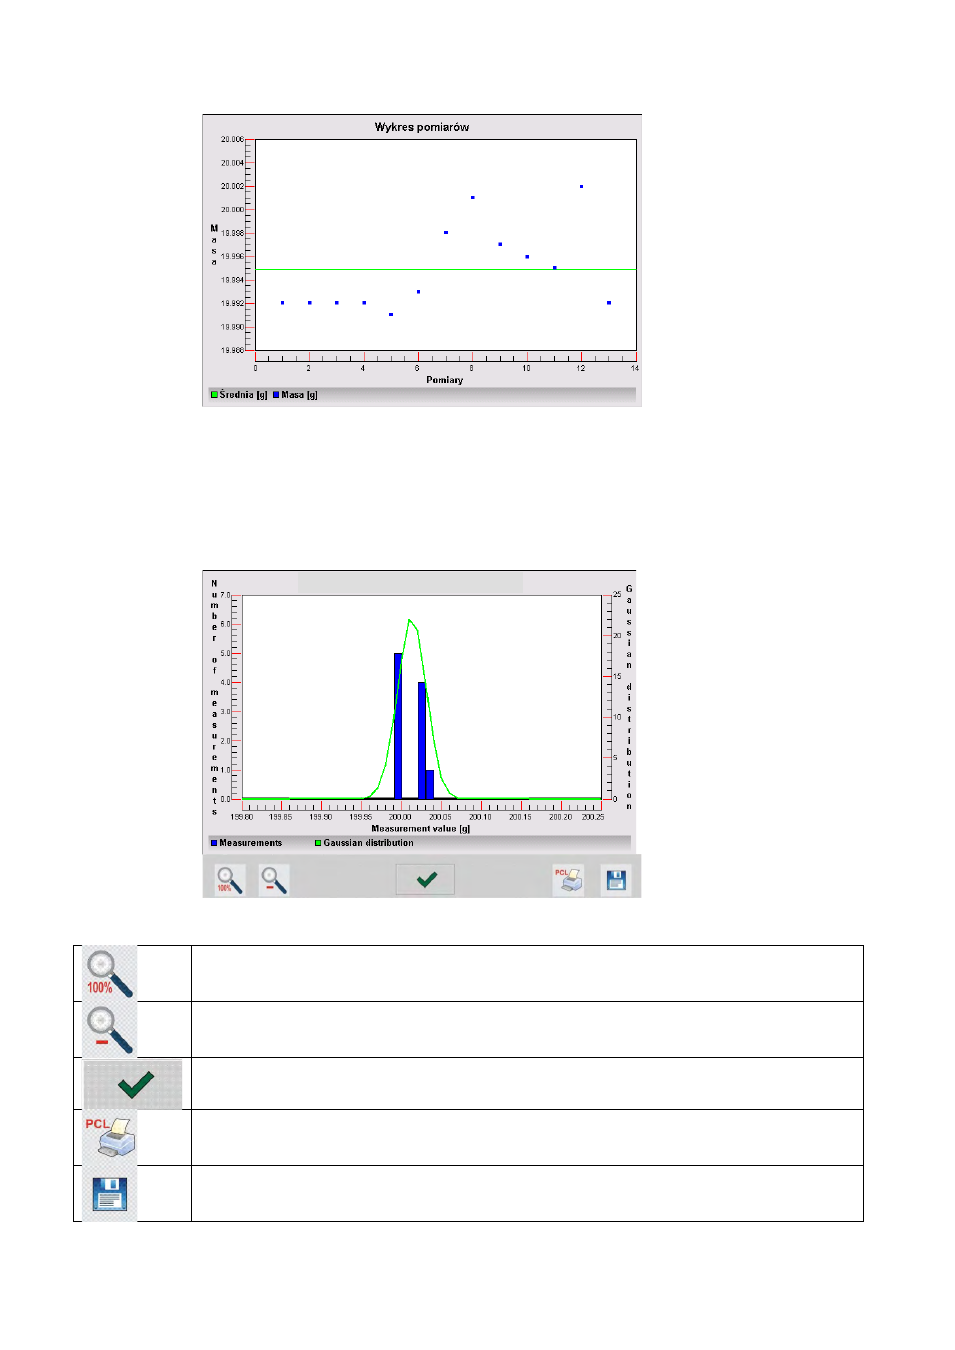
Probability distribution chart – on selecting this option the
software generates and displays chart of probability distribution for
completed measurement series. Below there is an instance of the
chart. The bar chart demonstrates quantities of the same
measurement in a series.
The bottom bar contains the following soft keys (options):
Return to displaying the complete chart
Zooming out the screen to the previous view
Return to displaying the previous window
Printing the chart on a connected printer PCL type
Saving the chart as a file in format *.bmp on an external data
storage device connected to terminal’s USB port.
Chart of probability distribution
This manual is related to the following products: