4 using the nagios report generator analyze mode, 5 messages reported by nagios – HP Insight Control Software for Linux User Manual
Page 240

25.14.4 Using the Nagios report generator analyze mode
The Nagios Report Generator (nrg) command features an analyze mode that can help you
determine the cause of a problem. It also offers information on the solution.
Enter following command to run the nrg analyze mode:
# nrg --mode analyze
Nodelist Description
-------- -------------------------------------------------------------------------
USE6371RA4 Enclosure Status - Warning> The enclosure is reporting one or more
warning conditions for environmental sensors gathered from the device.
Check the sensor status on the enclosure. Verify the status of the
Enclosures Collection Monitor which provides this data.
nh
Monitor collects sensor information from the blade system enclosures.
Enclosure status can be found in the Nagios Enclosure Status service
plug-in status. A critical status indicates that one or more of the
monitored enclosures has either posted a critical status or the
plug-in has been unable to contact the enclosure. Verify logon
credentials are correct if sensor data is not available.
mercury nh neptune
thresholds set in nagios_vars.ini. These are site specific values and
simply indicate resource usage above an expected range. Verify that the
node does not have a misbehaving job or some other problem causing it to
use more CPU then expected.
mercury neptune NodeInfo - Critical> Critical thresholds have been reached for max users,
processes, or zombies etc. See nagios_vars.ini for threshold values.
Values are site specific and critical values indicate values have been
exceeded.
25.14.5 Messages reported by Nagios
Nagios reports messages in the Service Detail and Service Problems windows. These messages
can help you detect current problems and prevent future problems.
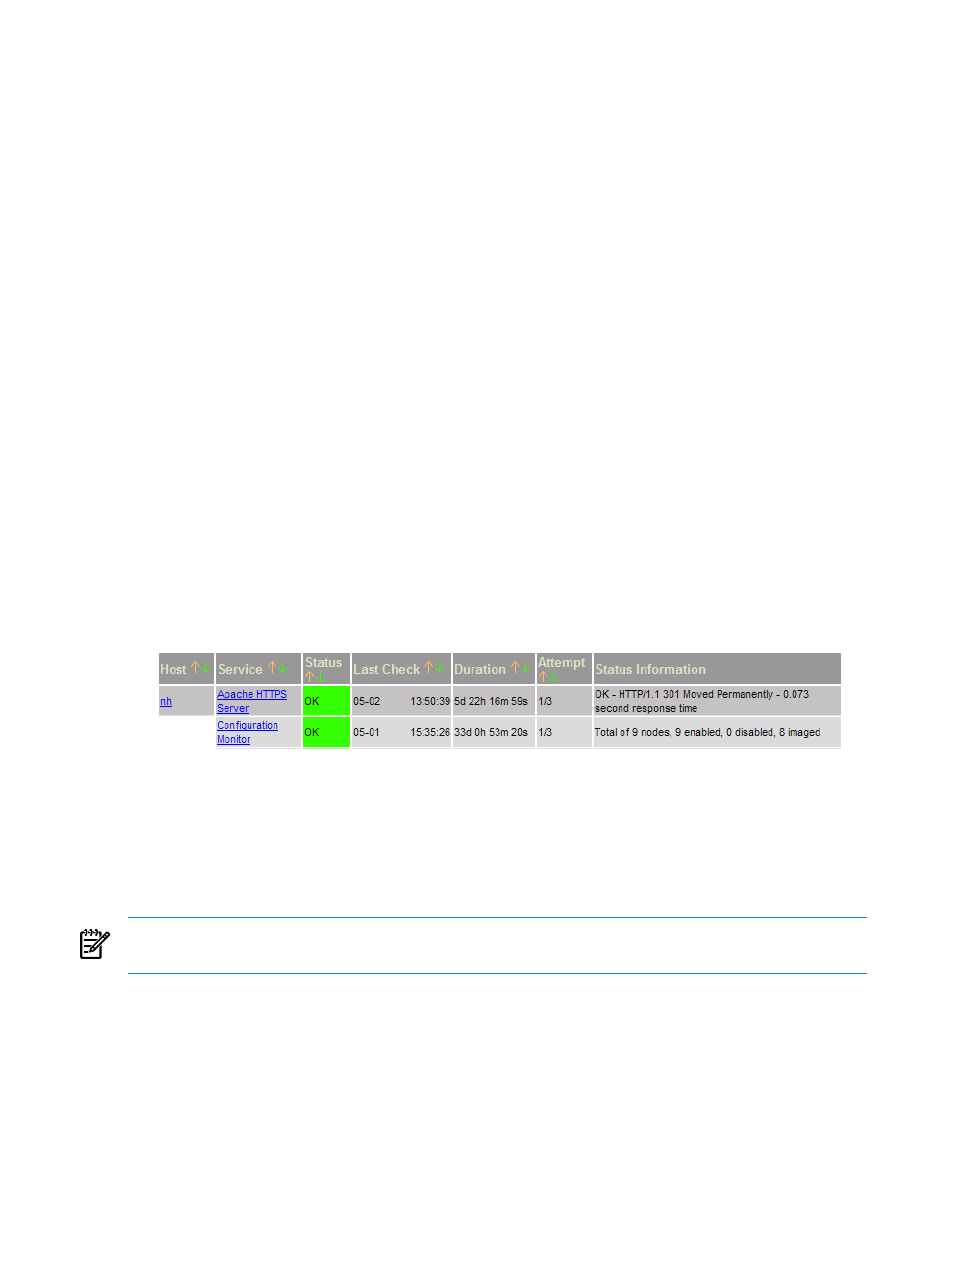
shows a portion
of the Nagios Service Detail window that displays two messages.
Figure 25-1 Sample Nagios messages
Messages are categorized in the Status column as OK, Unknown, Pending, Warning, and
Critical
and are color-coded.
The messages described in this section are indexed by the Service and Status Information columns.
The messages in this section are arranged alphabetically by the Service column entry. If there is
a warning or critical message, find the information for that service in the Status Information
column and apply it to the specified Nagios host.
NOTE:
The following messages are based on the default values. The messages differ if the
messages in the /opt/hptc/nagios/etc/misccommands.cfg file were changed.
Service: Apache HTTPS Server
Status Information: HTTPS performance information
Displays the status of the Apache
web server on the CMS.
Service: Configuration Monitor
Status Information: Node information
This message reports the total number of managed systems, the number of managed systems enabled,
the number of managed systems disabled, and the number of managed systems imaged.
No action is required.
240
Troubleshooting
