3 performance dashboard requirements, 4 interpreting the data in a ring plot – HP Insight Control Software for Linux User Manual
Page 188

20.8.3 Performance Dashboard requirements
The servers you want to monitor must fulfill the following requirements for using the Performance
Dashboard tool; the servers must be:
•
Licensed for Insight Control for Linux
•
Configured to use Insight Control for Linux monitoring services, as described in
20.8.4 Interpreting the data in a ring plot
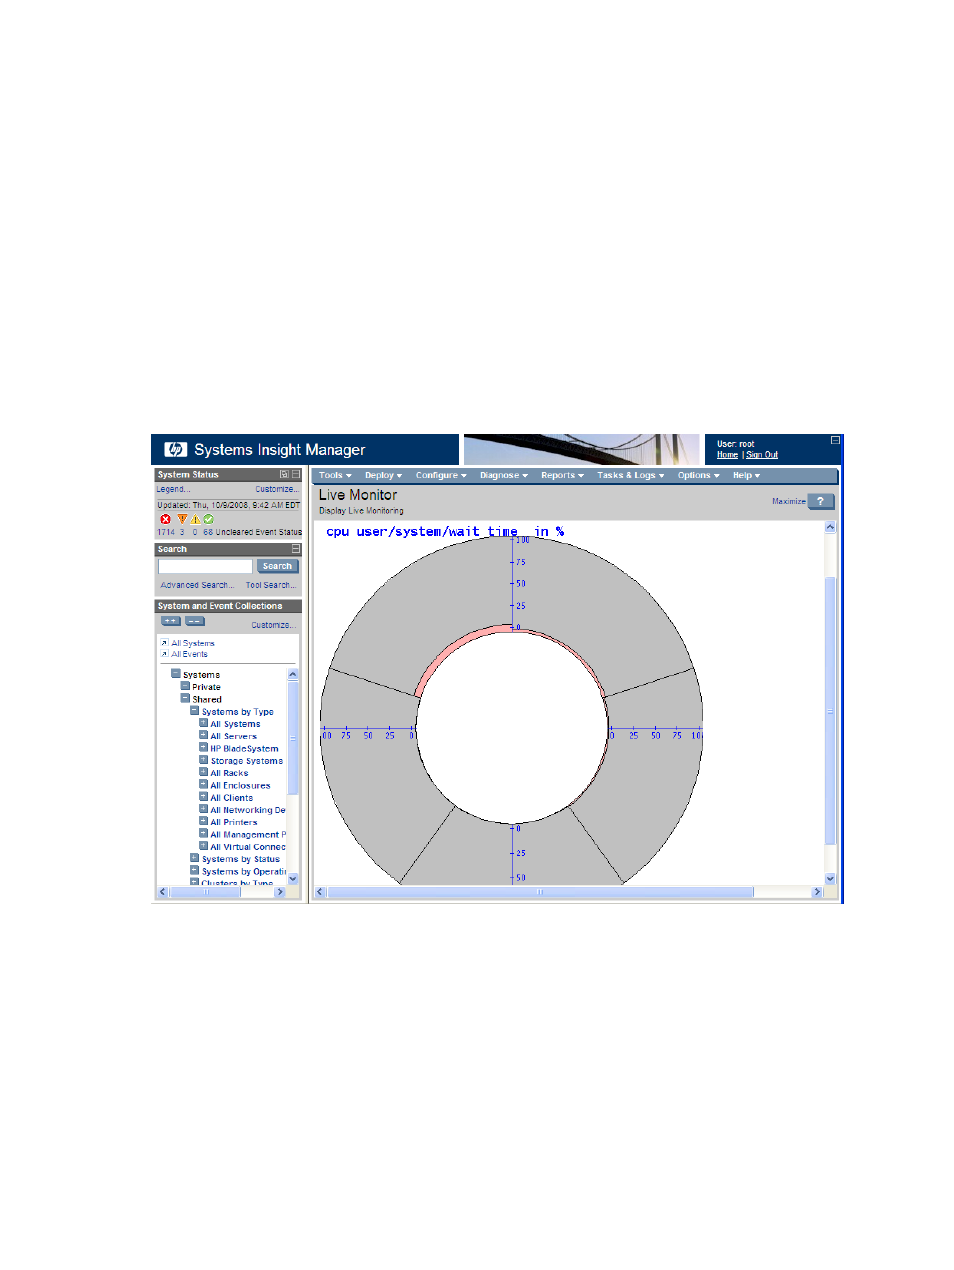
Each segment, or slice, of a Performance Dashboard ring plot represents data for one managed
server. Each metric is shown in its own ring plot, and each server has its own segment of the
ring plot. The ring plots are arranged in rows and columns based on the window size and the
number of ring plots displayed.
illustrates the Performance Dashboard tool's default view, the percent of CPU load.
The center dial shows the current value.
Figure 20-11 Performance Dashboard default view: percent of CPU load
illustrates three ring plots that are displaying the CPU load (percentage), system
uptime (in days) metrics, and a partial view of the free root file system space (percentage). The
center of the ring shows the current value for the metric as well as the minimum, average, and
maximum values of the selected managed systems.
describes how to use
the mouse buttons to display additional metrics.
188
Using graphical tools to monitor managed systems
