Yokogawa Touch Screen GP20 User Manual
Page 81
3-51
IM 04L61B01-01EN
Displaying and Converting Data
1
2
3
4
5
6
7
8
9
10
11
12
App
Index
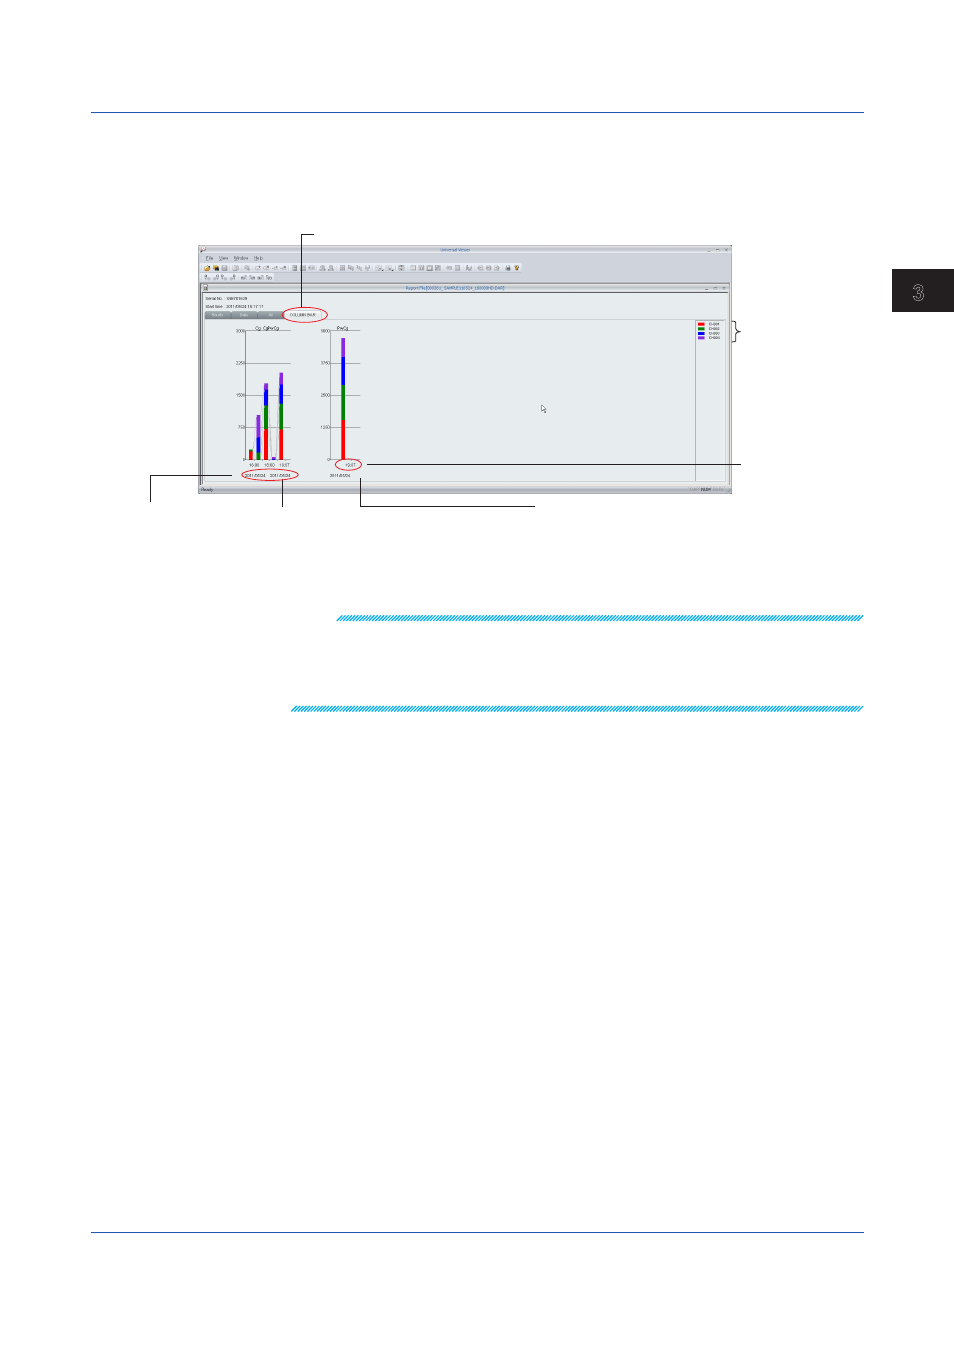
Stacked Bar Graph Display (Column Bar tab)
If the report data contains sum values, stacked bar graphs will be drawn on the Column Bar
tabbed page. In reference to the first channel whose sum value is greater than or equal to
zero, all channels whose unit is the same as the reference channel or all channels whose
sum value is greater than or equal to zero are summed and displayed in a bar graph.
Horizontal axis
display
Hourly report
For “daily+weekly,” the daily report is displayed.
For “daily+monthly,” the daily report is displayed.
Column Bar tab
Channel
display
Daily report
For “daily+weekly,” the weekly report is displayed.
For “daily+monthly,” the monthly report is displayed.
absolute time
The tabs are displayed from left to right in the following order: hourly, daily, weekly, monthly,
batch, custom-daily, and free.
Note
• You cannot change the channel colors of bar graphs.
• The horizontal axis and the time display format vary depending on the file type. You cannot
change them.
• All channels in the report file are displayed in a single window.
• Channels that contain errors, over-range, or negative values are not displayed.
3.8 Viewing Report Files