Yokogawa Touch Screen GP20 User Manual
Page 43
3-13
IM 04L61B01-01EN
Displaying and Converting Data
1
2
3
4
5
6
7
8
9
10
11
12
App
Index
Changing the Grid Display (Y-axis and time axis)
Click either one to select.
Select a density from the
Y-Axis menu, or click the corresponding button on the toolbar.
To change the density of the grid lines on the time axis (X-axis), select a density from the
TimeAxis menu, or click the corresponding button on the toolbar. You can select the grid
line density from five levels.
Note
In the following situations, only the grid lines that correspond to the scale lines on the Y-axis are
displayed.
• If you specified the grid line spacing in the Display Group Setting dialog box
• When the Y-axis scale is set to exponential display
In addition, how the Y-axis grid is displayed varies depending on the Y-axis zone mode as follows:
• In Full Zone or Slide Zone mode, the grid lines for the Y-axis of the active waveform are
displayed.
• In Auto Zone mode, the grid lines for all the displayed Y-axes are displayed.
• In Free Zone mode, the grid lines for the Y-axis of the active waveform are displayed. If there
are other Y-axes above or below, the grid lines for those axes are also displayed.
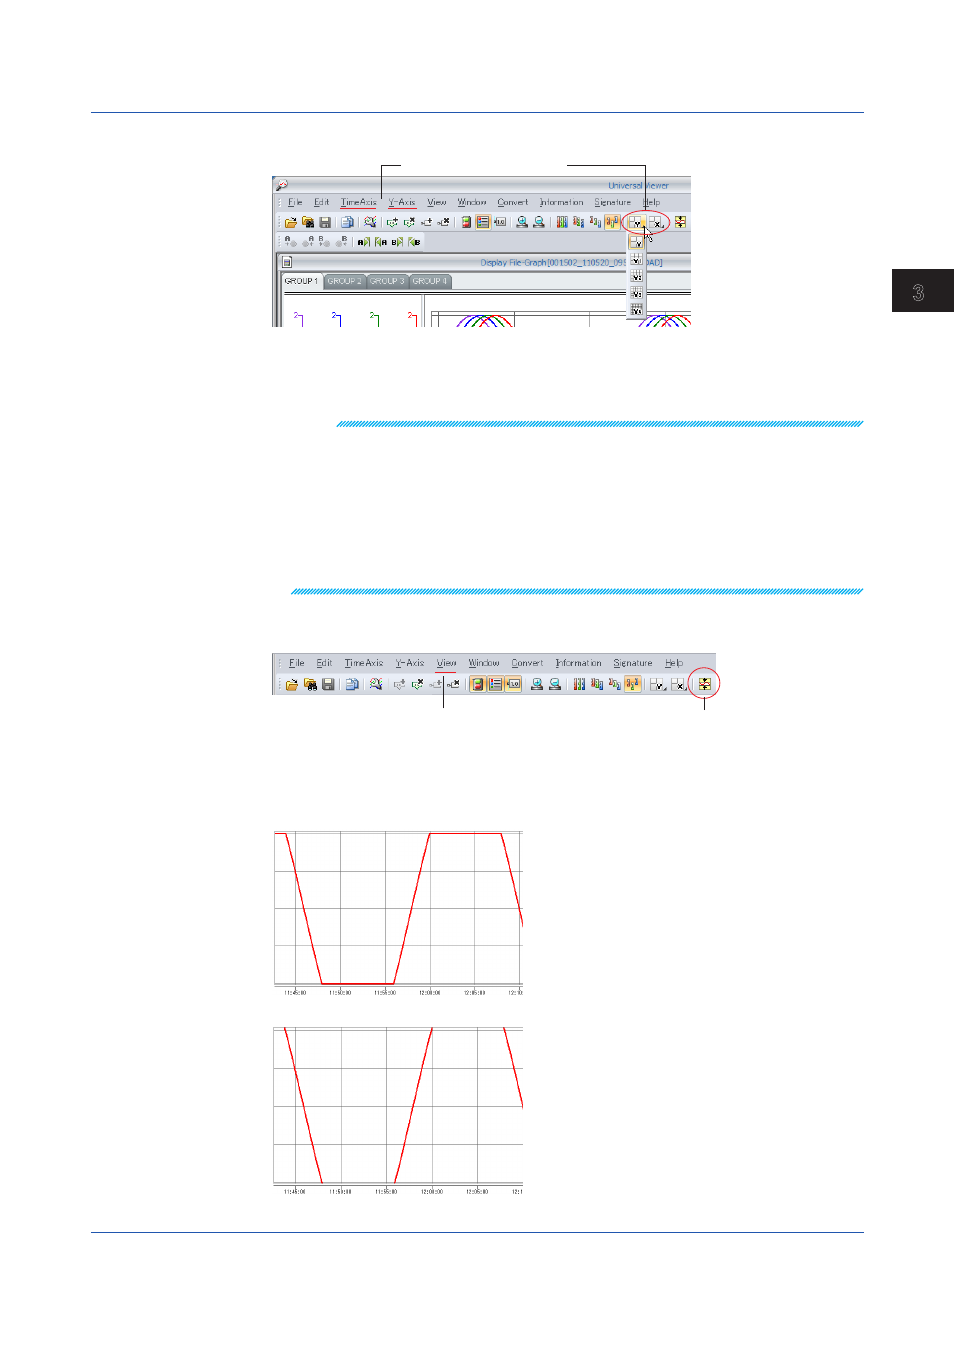
Waveform Display Limit (Clip)
On the
Y-Axis menu, click Clip. Or, click the corresponding button on the toolbar.
Clip
Click here to select.
When you apply the waveform display limit, the Y-axis display range is limited to the
minimum and maximum values that you specified using Scale in Display Group Setting.
Measured values that are less than the minimum value of the scale are set to the minimum
value, and values that are greater than the maximum value are set to the maximum value.
Example when display limit is applied
Example when display limit is not applied
3.1 Displaying Waveforms