2 displaying waveforms on a circular chart, 1 circular display window, Displaying waveforms on a circular chart -25 – Yokogawa Touch Screen GP20 User Manual
Page 55: Circular display window -25
3-25
IM 04L61B01-01EN
Displaying and Converting Data
1
2
3
4
5
6
7
8
9
10
11
12
App
Index
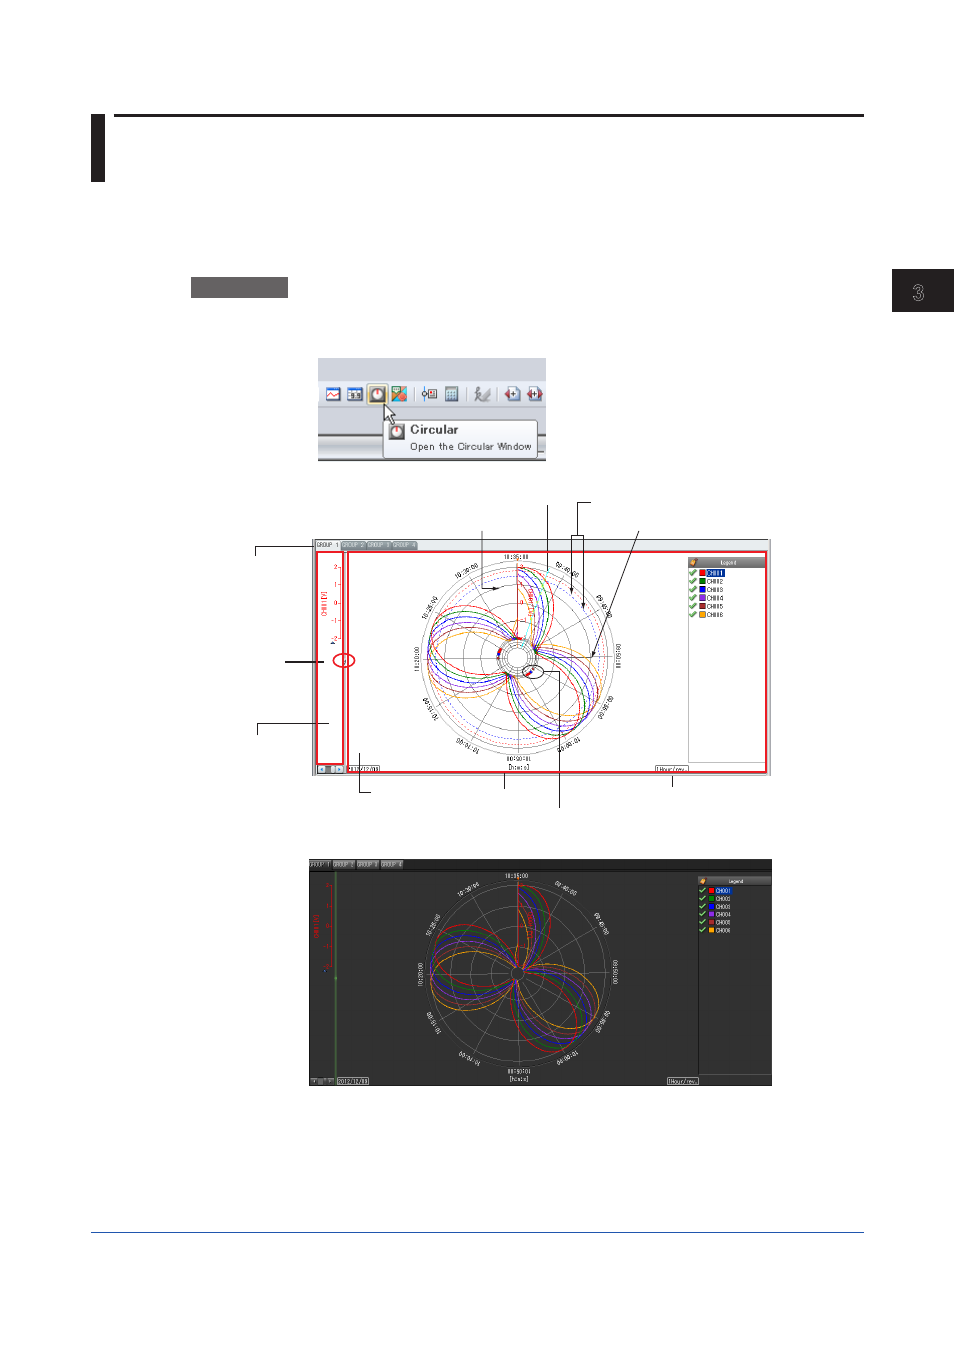
3.2 Displaying Waveforms on a Circular Chart
You can display data sampled on different channels of a recorder as waveforms on a circular
chart.
3.2.1
Circular Display Window
Procedure
1
To open the circular display window, on the
Window menu, click Circular. Or, click the
Circular button.
The circular chart appears.
Tabbed page
Y-axis grid line
Y-axis area
Cursor
(Select the tab of
the group to display.)
Vertical splitter
(Drag horizontally
to change the width
of the Y-axis area.)
Circular display example (light style)
Time axis grid line
Graph area Absolute
or relative time
Display time per cycle
Display trip lines (red and blue broken lines)
Alarm display area
Circular display example (dark style)
This section explains display setting operations that are different from the waveform display
window.