1 tlog file display window, Tlog file display window -47 – Yokogawa Touch Screen GP20 User Manual
Page 77
3-47
IM 04L61B01-01EN
Displaying and Converting Data
1
2
3
4
5
6
7
8
9
10
11
12
App
Index
3.7 Displaying and Converting a TLOG File (CX1000/
CX2000, DX100/DX200/DX200C, DX100P/DX200P,
or MV100/MV200)
You can display TLOG files created by a CX1000/CX2000, DX100/DX200/DX200C,
DX100P/DX200P, or MV100/MV200. TLOG files have .dtg extensions.
3.7.1
TLOG File Display Window
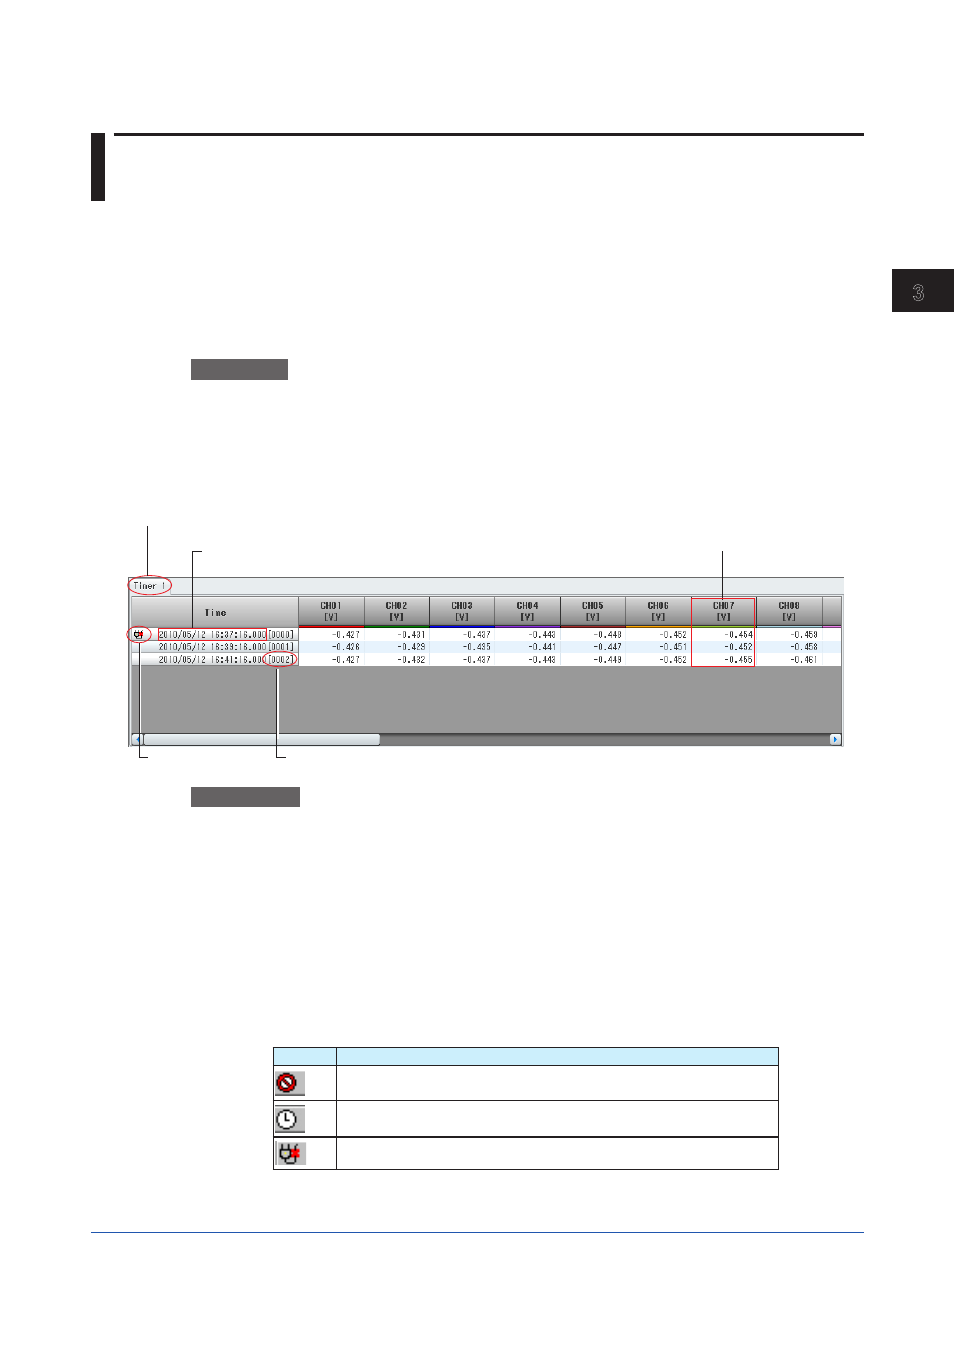
The TLOG file display window shows data of different timers collected during TLOG memory
sampling. Digital values are grouped by timers and displayed on separate tabs.
Procedure
1
Open a TLOG file.
On the
File menu, click Open to select the TLOG file you want to open. You can also
click
Open on the toolbar.
Data will appear.
Three timers can be used during TLOG memory sampling. The data of the timer with the smallest
number is displayed on the front-most tab.
Flag
Time when the data entry was sampled
Data number
Channel information
Channel name, unit, waveform color, and time values
Timer that was used to sample data
Explanation
Switching the Channel String
On the
View menu, click Channel or Tag No. to select the display mode.
Switching the Time Display Format
On the
View menu, click Date or Time to select the format.
Showing or Hiding Data Numbers
On the
View menu, turn on Data No. to show data numbers after timestamps. Turn it off to
hide them.
Showing or Hiding Flags
One the
View menu, turn on Flags to show the following status information.
Display Description
Stopped TLOG computation.
The recorder’s date and time were changed during TLOG computation.
Power failure occurred during TLOG computation.
If multiple flags are present, they are displayed overlapped with the following precedence
from top to bottom: stop, time change, and power failure.