Chapter 3 displaying and converting data, 1 displaying waveforms, 1 waveform display window – Yokogawa Touch Screen GP20 User Manual
Page 31: Displaying waveforms -1, Waveform display window -1, Index
3-1
IM 04L61B01-01EN
Displaying and Converting Data
1
2
3
4
5
6
7
8
9
10
11
12
App
Index
3.1 Displaying Waveforms
You can display data sampled on different channels of a recorder as waveforms on graphs
that display time on the horizontal axis and values on the vertical axis (Y-axis).
3.1.1
Waveform Display Window
When you open a display data file and an event data file, the data is first displayed as
waveforms. To open a window that you closed before, follow the procedure below.
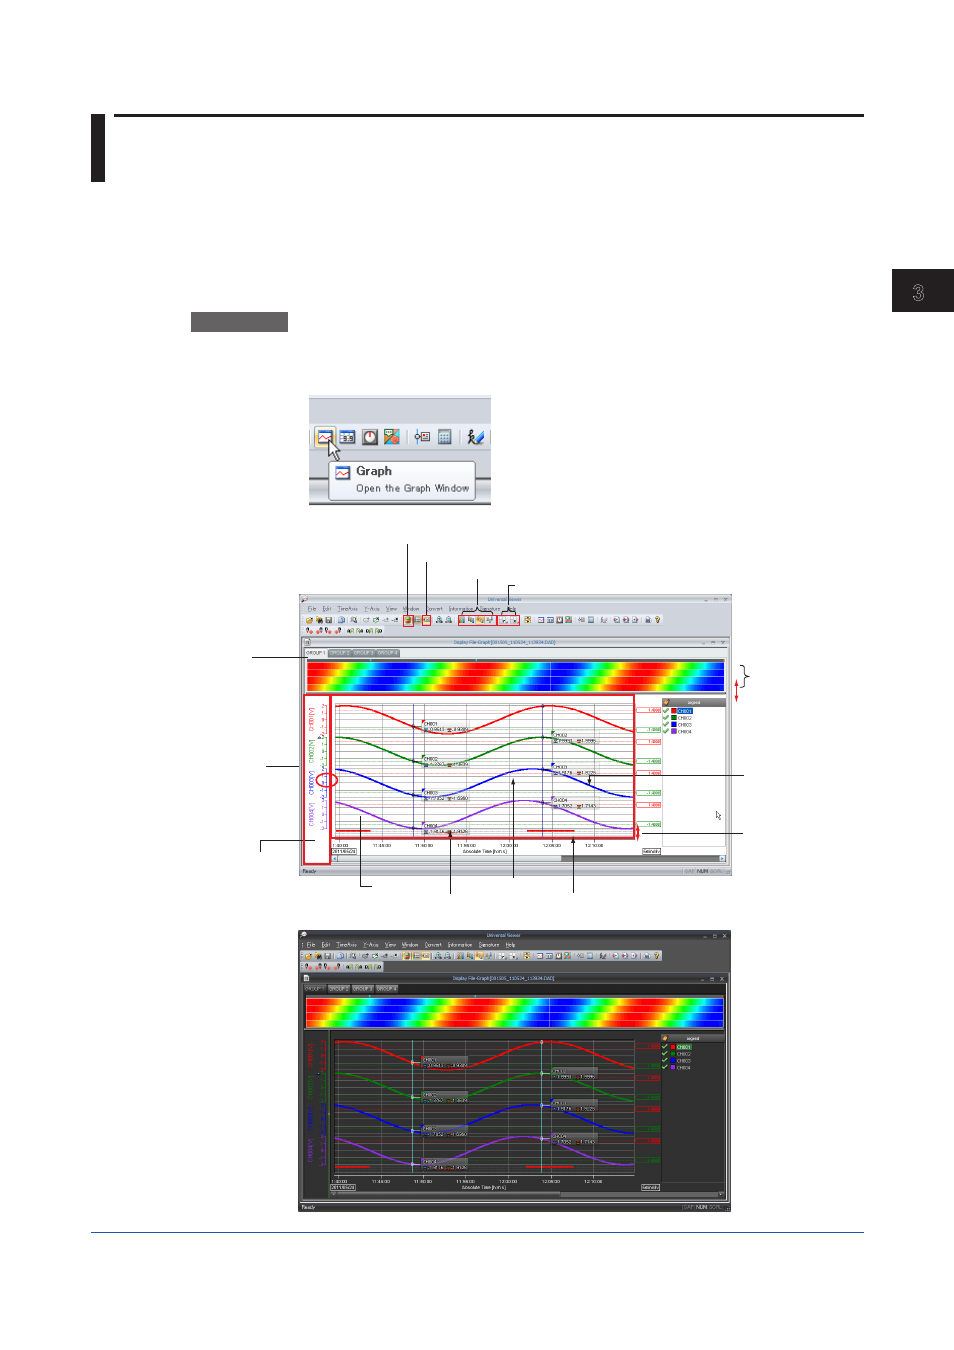
Procedure
1
To open the waveform display window, on the
Window menu, click Graph. Or, click
the
Graph button.
Waveforms will appear.
Select the grid.
Color overview
Cursor value
Alarm display area
Y-axis area
Mark note
Select the Y-axis display mode.
Cursor value display
Horizontal splitter
(Drag vertically
to display the
color overview.)
Show or hide alarms.
Show or hide cursor values.
Tabbed page
(Select the tab of
the group to display.)
Vertical splitter
(Drag horizontally
to change the width
of the Y-axis area.)
Waveform display example (light style)
Time axis
Graph area
Waveform display example (dark style)
Chapter 3 Displaying and Converting Data