Yokogawa Touch Screen GP20 User Manual
Page 48
3-18
IM 04L61B01-01EN
Statistics
The Statistics dialog box shows calculated results for values between the cursors.
You can move cursor positions, update calculation results, and copy data to the clipboard.
Procedure
1
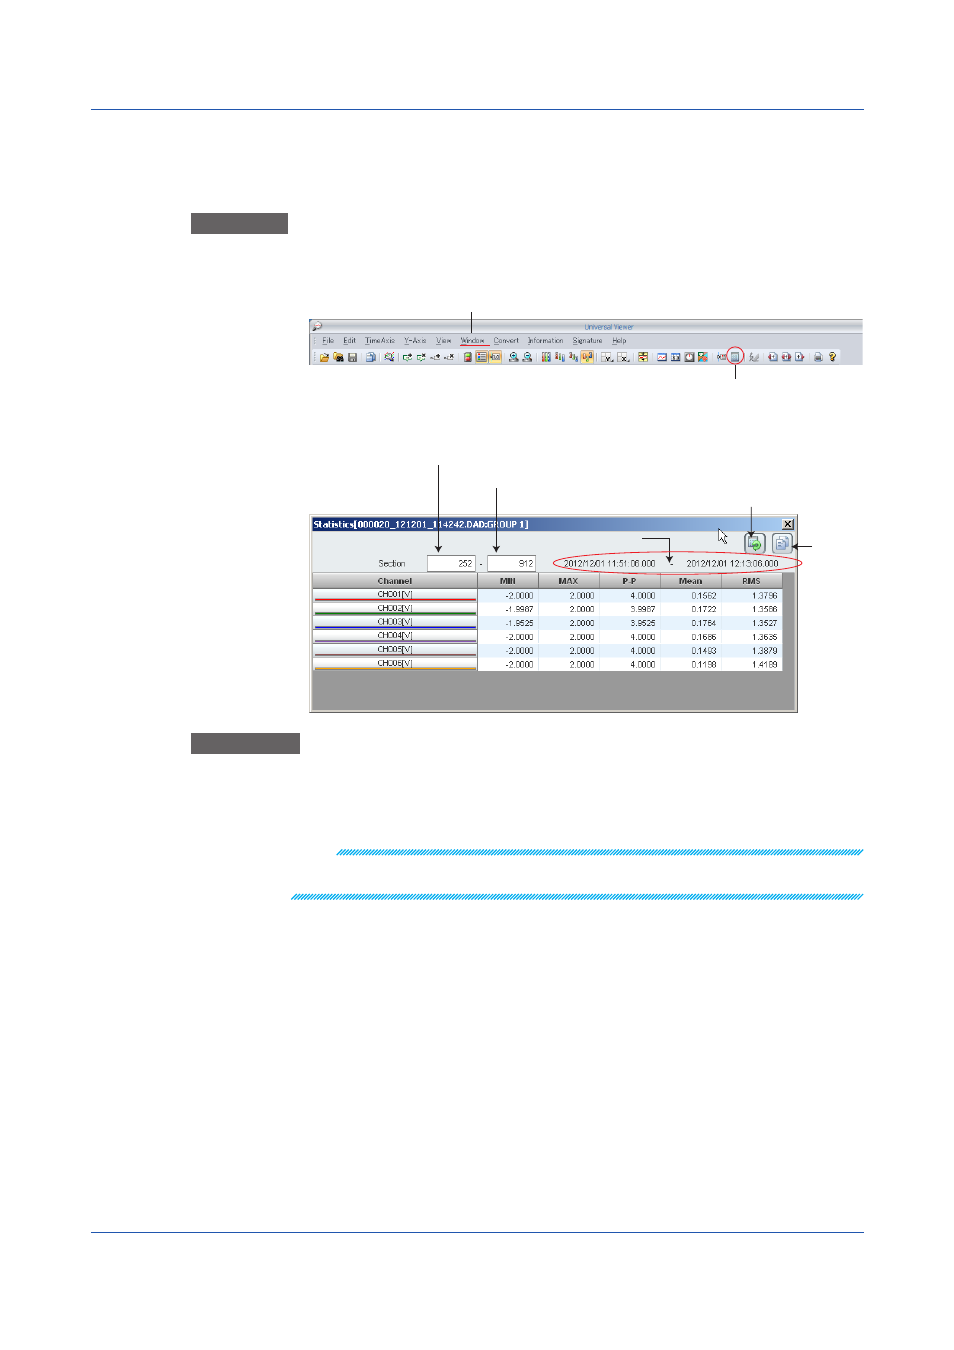
On the
Window menu, click Statistics. Or, click the corresponding button on the
toolbar.
Click here to select.
Calculate the section between
the cursors.
The Statistics dialog box appears.
Time
Number of the last data point in the computed region (cursor B)
Copy
Recompute
Number of the first data point in the computed region (cursor A)
Explanation
The minimum, maximum, P-P, mean, and rms values for each waveform in the range
specified by cursors A and B are calculated and displayed.
Clicking the Copy button copies the contents of the Statistics dialog box to the clipboard.
You can paste the contents to a tab separated text file or to an Excel spreadsheet.
Note
Calculated results are not synchronized to the cursor positions or waveform group. If you change
the cursor A or B position or the display group, click
Re-calc. to update the calculated results.
3.1 Displaying Waveforms