Section 3.6, 1 operation log tabbed page – Yokogawa Touch Screen GP20 User Manual
Page 70
3-40
IM 04L61B01-01EN
3.6 Listing the Operation Log (DX100P/DX200P or
DX1000/DX1000N/DX2000 with the /AS1 option)
You can display operation logs of display data files and event data files that have been
sampled on the DX100P; DX200P; or DX1000, DX1000N, or DX2000 with the /AS1 option.
Operation logs are displayed on the Operation Log tabbed page in the Alarm/Mark window
(
). The file name extension is .GDS, .DSD, or .DBD (display data files) or .GEV,
.DSE, .DBE (event data files).
3.6.1
Operation Log Tabbed Page
The Operation Log tabbed page lists operation log information in data files.
Procedure
1
To open the list display window, on the
Window menu, click Alarm/Mark. Or, click the
Alarm Mark button on the toolbar.
The Alarm/Mark window will appear.
2
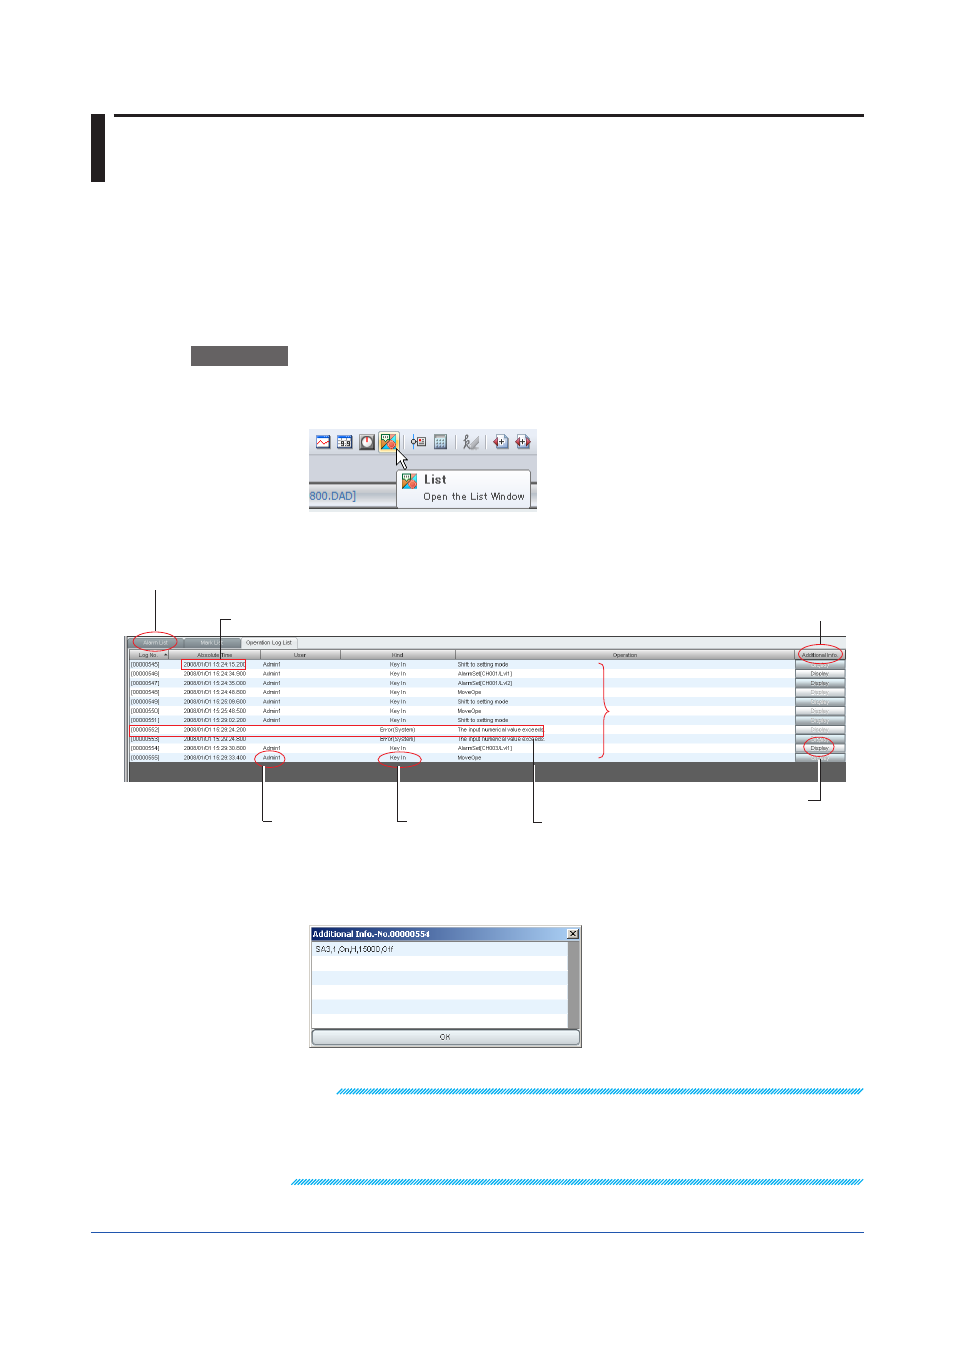
Click the
Operation Log tab.
User that executed
the operation
Absolute or relative time
Switch by selecting Absolute Time or Relative Time from the View menu.
Operation method
Operations that
were executed
Display button
Displays additional information
Additional information
Whether additional information
is available for the log entry
Operation log entry of setting change
(displayed with a shadow)
Serial number of operation log entries
For log entries that cannot be displayed in a single line,
Data Display appears under Additional
Info.
3.
Click
Data Display.
The Additional Info. box appears.
Note
If there are log entries of setting changes on the recorder that sampled the data, such entries are
emphasized with text shadowing.
For these entries, you can start the configuration software from Universal Viewer to check all the
settings of the recorder after the change. For instructions on how to start the configuration software,
see the next section.